
Avatar Diagnostic
AppNavi Avatar Diagnostic function helps detect potential issues in the applications where AppNavi is integrated.
Overview
AppNavi Avatar Diagnostic helps identify potential issues in applications where AppNavi is integrated. It checks whether native JavaScript objects have been modified and helps identify website event handlers that may interfere with AppNavi functionality.
Some applications modify standard JavaScript methods or register event handlers that affect how AppNavi works.
For example:
- If an application overrides JSON.parse in a non-standard way, AppNavi may not function correctly.
- If an application prevents default selection events, users may be unable to interact with the Avatar tooltip editor.
Avatar Diagnostic provides technical information that helps developers investigate these issues.
Also some websites attach event listeners which work in such a way that may prevent proper AppNavi functions.
For example, if following event exists, It may prevent clicking inside the tooltip editor.
window.onselect = function (e) { e.preventDefault(); }Therefore, looking at the above issues, its necessary for AppNavi to detect which Native objects have been modified and which events have been registered by the website so that when its time to debug the issues, developers are equiped with the information that they need.
When to Use Avatar Diagnostic
Use Avatar Diagnostic when:
- AppNavi features do not work as expected in a specific application.
- Users cannot interact with Avatar elements, tooltips, or editors.
- AppNavi behaves differently from one application to another.
- Developers suspect that the application has modified native JavaScript objects.
- The development or support team needs additional information to investigate an issue.
What objects does it track?
Currently it checks for the following Native objects. These are the most used objects used in AppNavi.
- Date
- Array
- Object
- String
- Number
- Boolean
- Function
- BigInt
- Symbol
- JSON
- Map
- Set
- WeakMap
- WeakSet
- Promise
- RegExp
- Window
- Document
The diagnostic output helps developers investigate potential modifications to these objects. A reported difference should be investigated before concluding that it is the cause of an AppNavi issue.
When Does Avatar Diagnostic Run
Its run 2 seconds after AppNavi is initialized and only runs when globalDebug is on.
To enable Global Debug Mode through the browser console, use:
appnavi.runtime.setGlobalDebug(true)After the diagnostic runs, its output appears in the browser Developer Tools console.
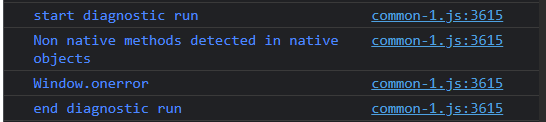
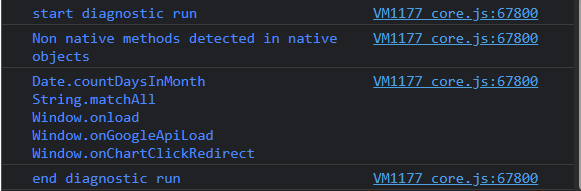
Please note that diagnostic output is logged as debug and therefore only visible to user when All or Verbose mode is selected in the browser console.
For more information, see Global Debug Mode.
How to Run Avatar Diagnostic Manually
Sometimes its desirable to not rely on the automatic diagnostic call, instead call it manually. In order to call it manually one can use following code.
Standard Diagnostic
Run the following command in the browser Developer Tools console
This runs the diagnostic and displays its output in the console.
appnavi.diagnostic.run()Detailed Diagnostic
To include the method body in the diagnostic output
Use the detailed diagnostic when additional information is required to investigate a suspected JavaScript modification.
To see more detailed diagnostics, call diagnostic with true parameter and it will output the method body as well.
appnavi.diagnostic.run(true)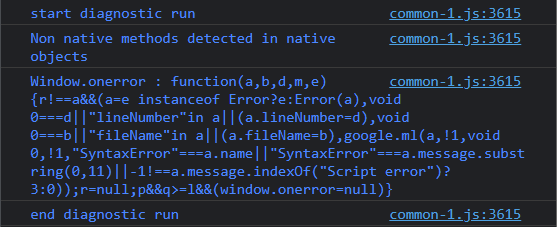
Note: The detailed output is intended for technical investigation. If you are unsure how to interpret it, share the relevant information with AppNavi Support or your development team.
Whats the impact?
In order to keep impact of diagnostic class minimum, we execute it 2 seconds after AppNavi is initialized. Also the automatic run is conditional as it only runs when global debug is on.
Therefore we can say that for normal users, there is no impact at all. For tech users who have global debug enabled, there is only minimum impact as it runs after 2 seconds.
Global Debug Mode
Display the enhanced logging to the console.
The global debug mode is primarily designed to provide core members with enhanced details on the console regarding AppNavi.
When "global debug mode" is activated, users will have access to this enhanced level of detail. This includes all functions necessary for debugging an application, such as API calls, z-index calculations, mining events, and more.
If this option is disabled, users will not be able to view additional events or details on the console.
To enable this option, users can follow these steps:
- Navigate to the avatar icon.
- Click on the "Open Settings" icon.
- Access the "Settings" menu by clicking button.
- Locate the "Global Debug Mode" option from General settings section.
- Enable it to activate detailed logging on the console for both logged-in and logged-out users.
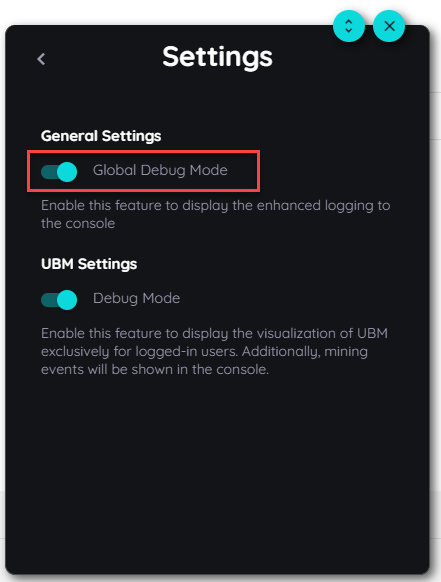
Global Debug Mode
When to Use Global Debug Mode
Enable Global Debug Mode when you need to:
- Investigate an AppNavi or Avatar issue.
- Troubleshoot why an AppNavi feature is not working as expected.
- Verify whether AppNavi events are being generated.
- Inspect API requests and responses related to AppNavi.
- Investigate element positioning or z-index-related issues.
- Provide additional technical information to AppNavi Support or development teams.
- Collect console information while reproducing an issue.
For normal users, Global Debug Mode should remain disabled unless troubleshooting instructions specifically require it.
Prerequisites
Before enabling Global Debug Mode:
- You must have access to the AppNavi Avatar.
- You should be able to open the browser's Developer Tools.
- If you are troubleshooting a specific issue, reproduce the issue after enabling debug mode so the relevant diagnostic information is captured.
- Use a supported browser and ensure the AppNavi Avatar is loaded correctly.
Tip: If AppNavi Support has asked you to collect diagnostic information, keep the issue description, affected application, URL, and steps to reproduce available while collecting the logs.
How to Enable Global Debug Mode
- Open the AppNavi Avatar.
- Click the Avatar icon.
- Click Open Settings.
- Open the Settings menu.
- In the General settings section, locate Global Debug Mode.
- Enable Global Debug Mode.
- Open the browser's Developer Tools.
- Select the Console tab.
- Reproduce the issue or perform the action that you want to investigate.
Global Debug Mode enables detailed logging in the console for logged-in users.
Where Debug Information Appears
The additional information is displayed in the browser's Developer Tools → Console.
Depending on the feature being investigated, the console can contain information related to:
- AppNavi API calls.
- Mining events.
- z-index calculations.
- Other AppNavi diagnostic information.
The exact messages displayed can vary depending on the AppNavi features being used and the activity performed while debug mode is enabled.
Privacy and Security Considerations
Debug information may contain technical details about the current application session, requests, events, URLs, or other information generated while using AppNavi.
Therefore:
- Only enable Global Debug Mode when it is required for troubleshooting.
- Do not share console output publicly.
When to Disable Global Debug Mode
Disable Global Debug Mode when troubleshooting is complete.
To disable it:
- Open the AppNavi Avatar.
- Click the Avatar icon.
- Open Settings.
- Go to General settings.
- Turn Global Debug Mode off.
After disabling it, AppNavi will no longer display the additional debug information provided by Global Debug Mode in the console.
Recommended : Keep Global Debug Mode disabled during normal usage and enable it only when troubleshooting or when requested by AppNavi Support team.
Troubleshooting: Symptoms, Results, and Actions
Use the following table to determine when to run Avatar Diagnostic, what the results may indicate, and what to do next.
| Problem or symptom | What to check | What the result may indicate | Recommended action |
|---|---|---|---|
| AppNavi features behave incorrectly in one application | Run Avatar Diagnostic and inspect the console output. | A native JavaScript object may have been modified by the host application. | Review the reported object and investigate whether the application overrides its standard behavior. |
| Tooltip editor does not respond to clicks or text selection | Check for event handlers that prevent default browser behavior. | A website event handler may be interfering with normal user interaction. | Investigate the relevant event handlers and confirm whether they affect AppNavi elements. |
| AppNavi works in one application but not another | Run the diagnostic in the affected application and compare the results with a working application. | The applications may have different JavaScript environments or event handlers. | Share the relevant console output and reproduction steps with the development team. |
| Diagnostic output is missing | Check whether Global Debug Mode is enabled and the console is set to All or Verbose. | The diagnostic may not have run automatically, or debug messages may be filtered out. | Enable Global Debug Mode, Important: Diagnostic output provides investigation clues, not a definitive diagnosis. A reported modification does not automatically mean it is responsible for the observed problem.reload or reproduce the issue, and run appnavi.diagnostic.run() if necessary. |
| The standard diagnostic does not provide enough detail | Run appnavi.diagnostic.run(true). | More information about the method body may help with the investigation. | Review the detailed output with a developer or AppNavi Support. |
| AppNavi Avatar does not appear on the page | Check the application URL, integration, and browser console before running the diagnostic. | The issue may be related to integration, application configuration, or blocked resources rather than a modified JavaScript object. | Follow If AppNavi does not appear and investigate any relevant console errors. |
Important: Diagnostic output provides investigation clues, not a definitive diagnosis. A reported modification does not automatically mean it is responsible for the observed problem.
Updated 11 days ago