Area
Overview
The Areas feature in Insights allows organizations to track user interactions within specific sections of an application. It helps in analyzing engagement metrics, optimizing workflows, and improving user experience.
Many organizations struggle to understand how users interact with different sections of an application. The Areas feature provides clear insights into:
- User Engagement: Track where users click, navigate, and interact.
- Performance Optimization: Identify areas with low engagement or usability issues.
- Improved Decision-Making: Data-driven insights help refine workflows and enhance user experience.
Why Organizations Need Area Tracking
- Helps Tenant Owners track how users engage with specific sections of an application.
- Provides detailed analytics on interaction frequency and user behavior.
- Enables automatic tracking of key actions like navigation, form submissions, table interactions, copy/paste actions, and more.
- Ensures data is available for optimizing application structure and improving user retention.
How Area Tracking Solves Problems
- Eliminates Guesswork: Organizations can see real-time data on user activity.
- Enhances Productivity: Identifies problem areas that slow users down.
- Boosts User Engagement: Understanding user behavior leads to better optimization strategies.
How to Configure an Area
To start tracking user interactions within specific areas, Tenant Owners must follow these steps:
Step 1: Assign Insights Contract
- Ensure the Insights contract is assigned to the application.
- Navigate to the Insights tab.
- Select the specific application.
- Open Application Settings.
- Enable Insights Recording.
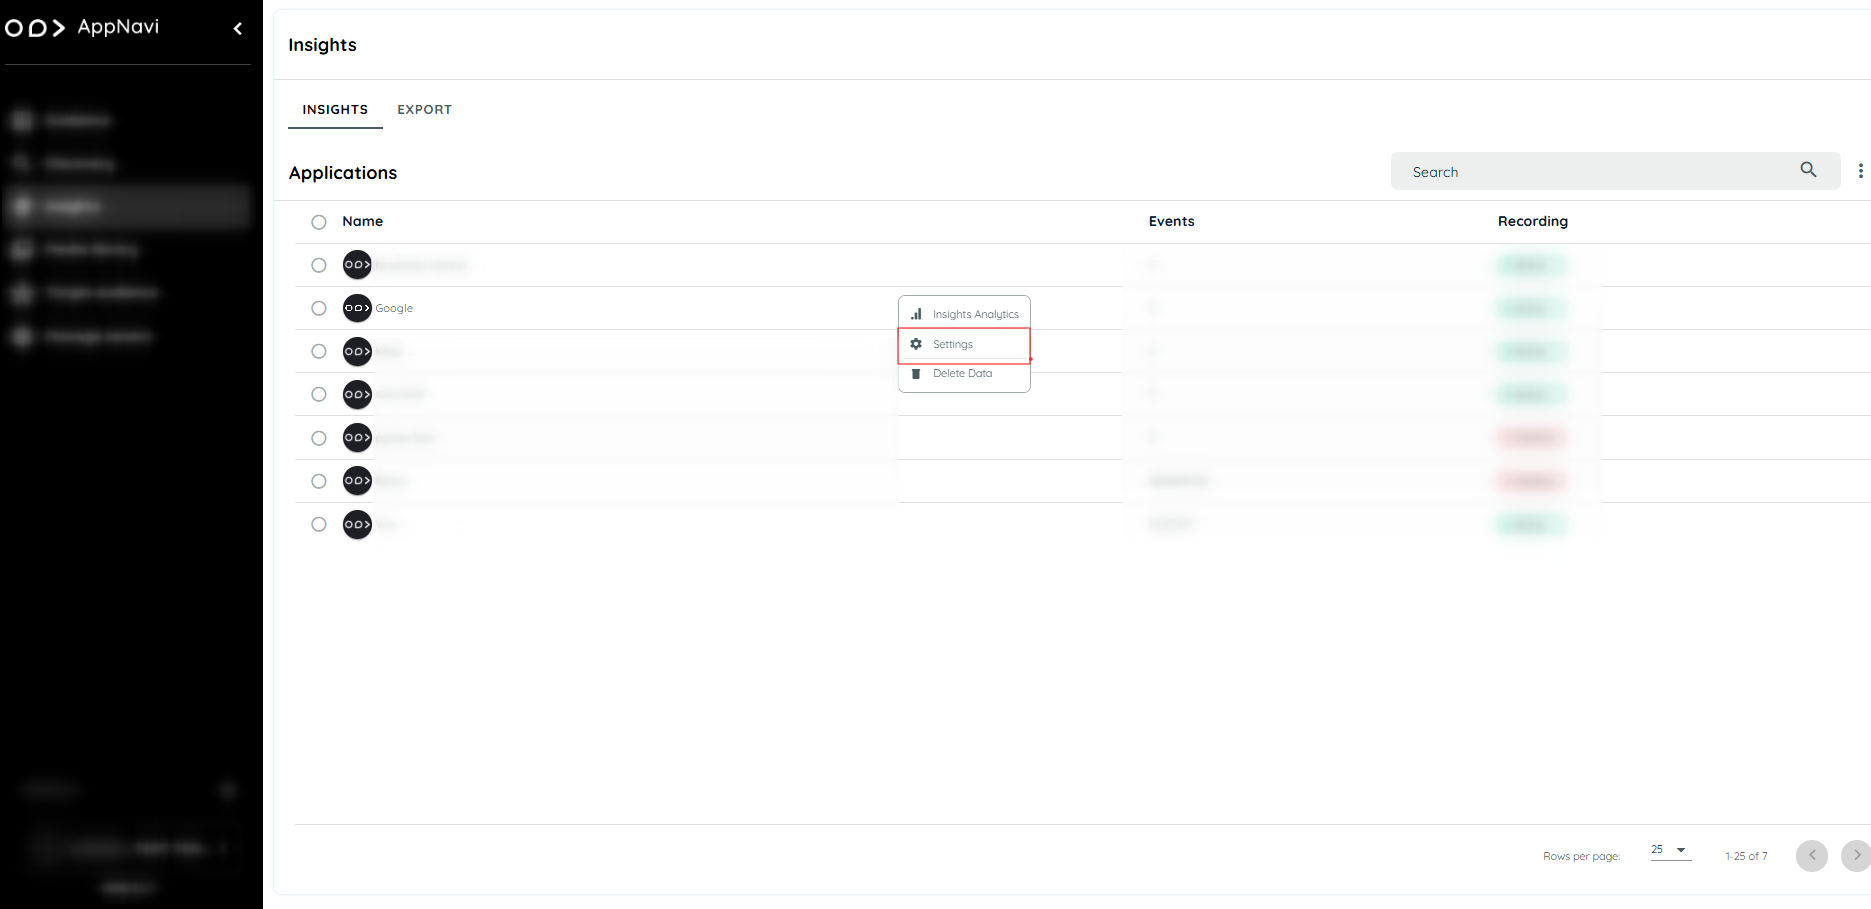
Insights Settings
Step 2: Configure an Area
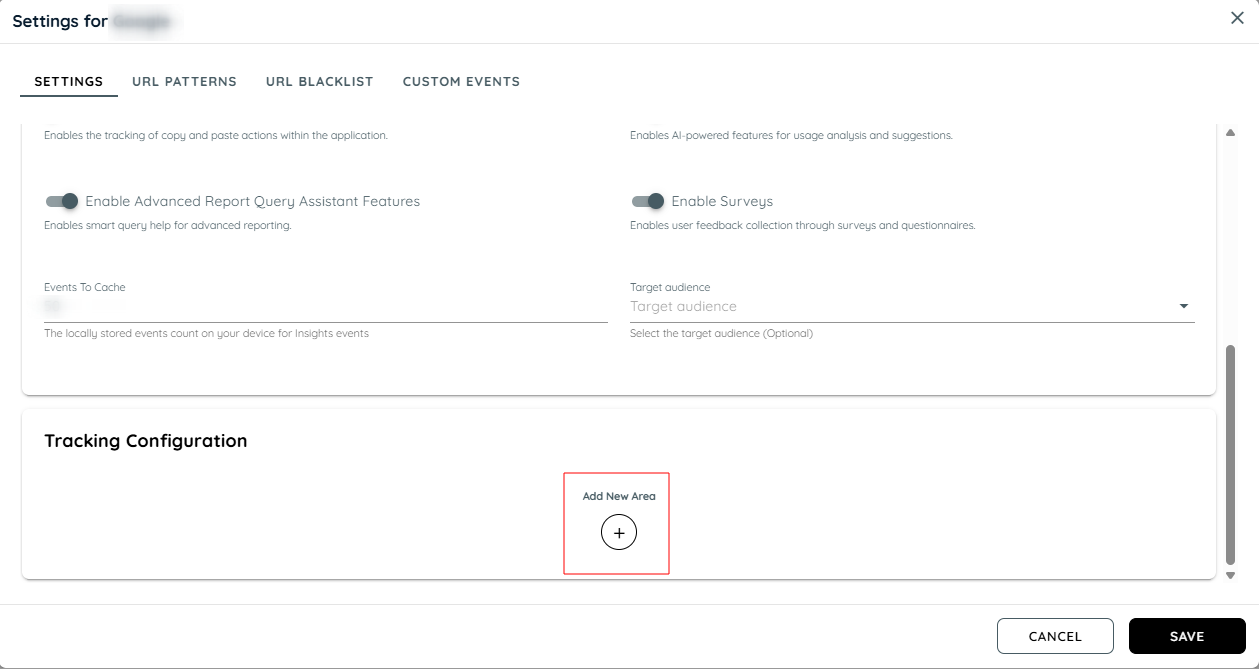
Configure Area
- In the Insights setting, go to Areas.
- Click the + (Add Area) button.
- Activate the Area Tracking Toggle.
- Enter an Area Name.
- Select an Area Type:
- Container (default type)
- Table
- Navigation
- Form
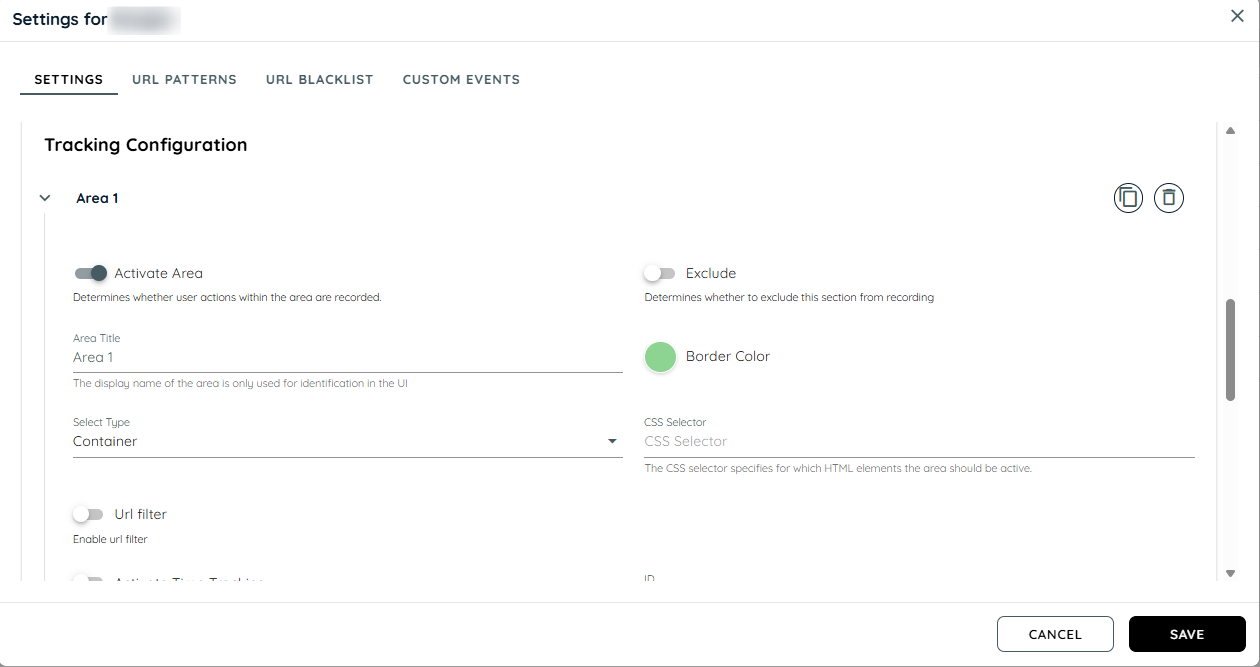
Tracking Area Configuration
- Provide the CSS Selector (specifies which elements are trackable).
- Enable URL Filtering.
- Activate Time Tracking (tracks user activity time within an area).
- Set Target Audience (to limit tracking to specific user groups).
Configure Journey Settings:
- Enable Consider in Journey (includes area data in Journey View).
Select Aggregation Type:
- ID
- Label
- ID and Label
Enable Text Extraction and select Extraction Type:
- Auto (default and recommended)
- Selector
- Static Text
- URL
- Enable Auto Detection for Trackable Elements (automatically recognizes interaction elements within the area).
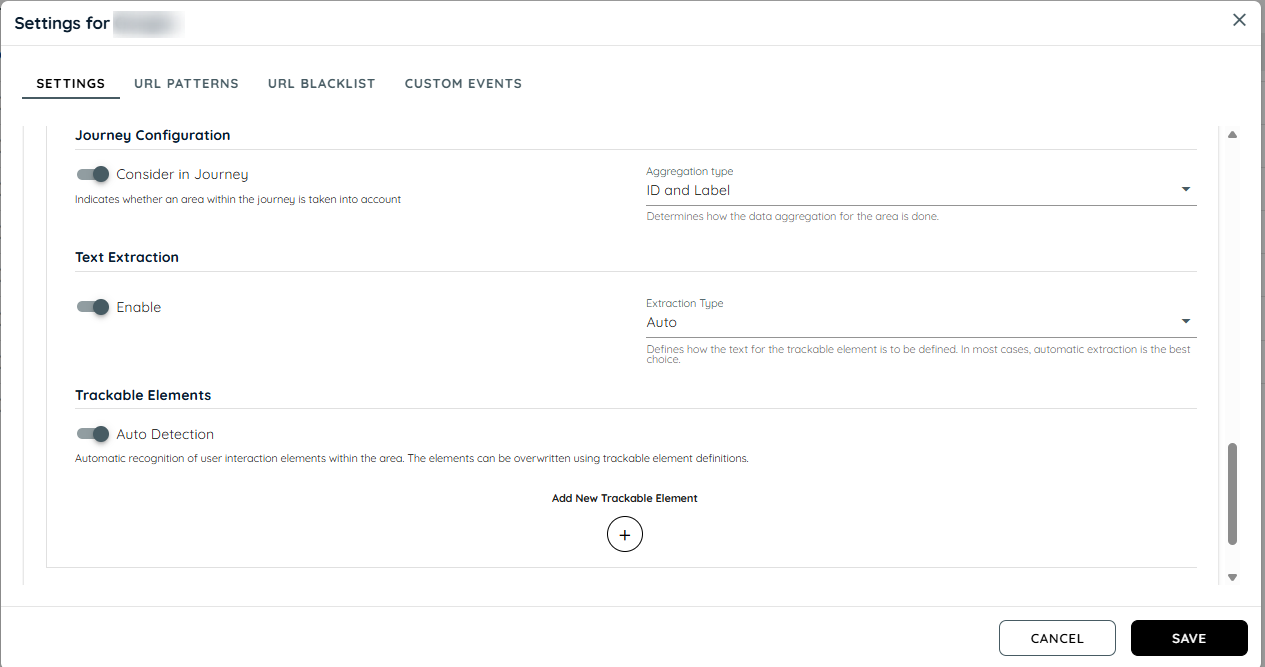
Journey Configuration
How to Use the Areas Tab
The Areas tab provides a comprehensive view of all areas defined within the application, displaying relevant engagement metrics and allowing users to analyze activity by area. Each area is grouped by its unique ID, and data is dynamically updated to reflect user interactions across specified time frames.
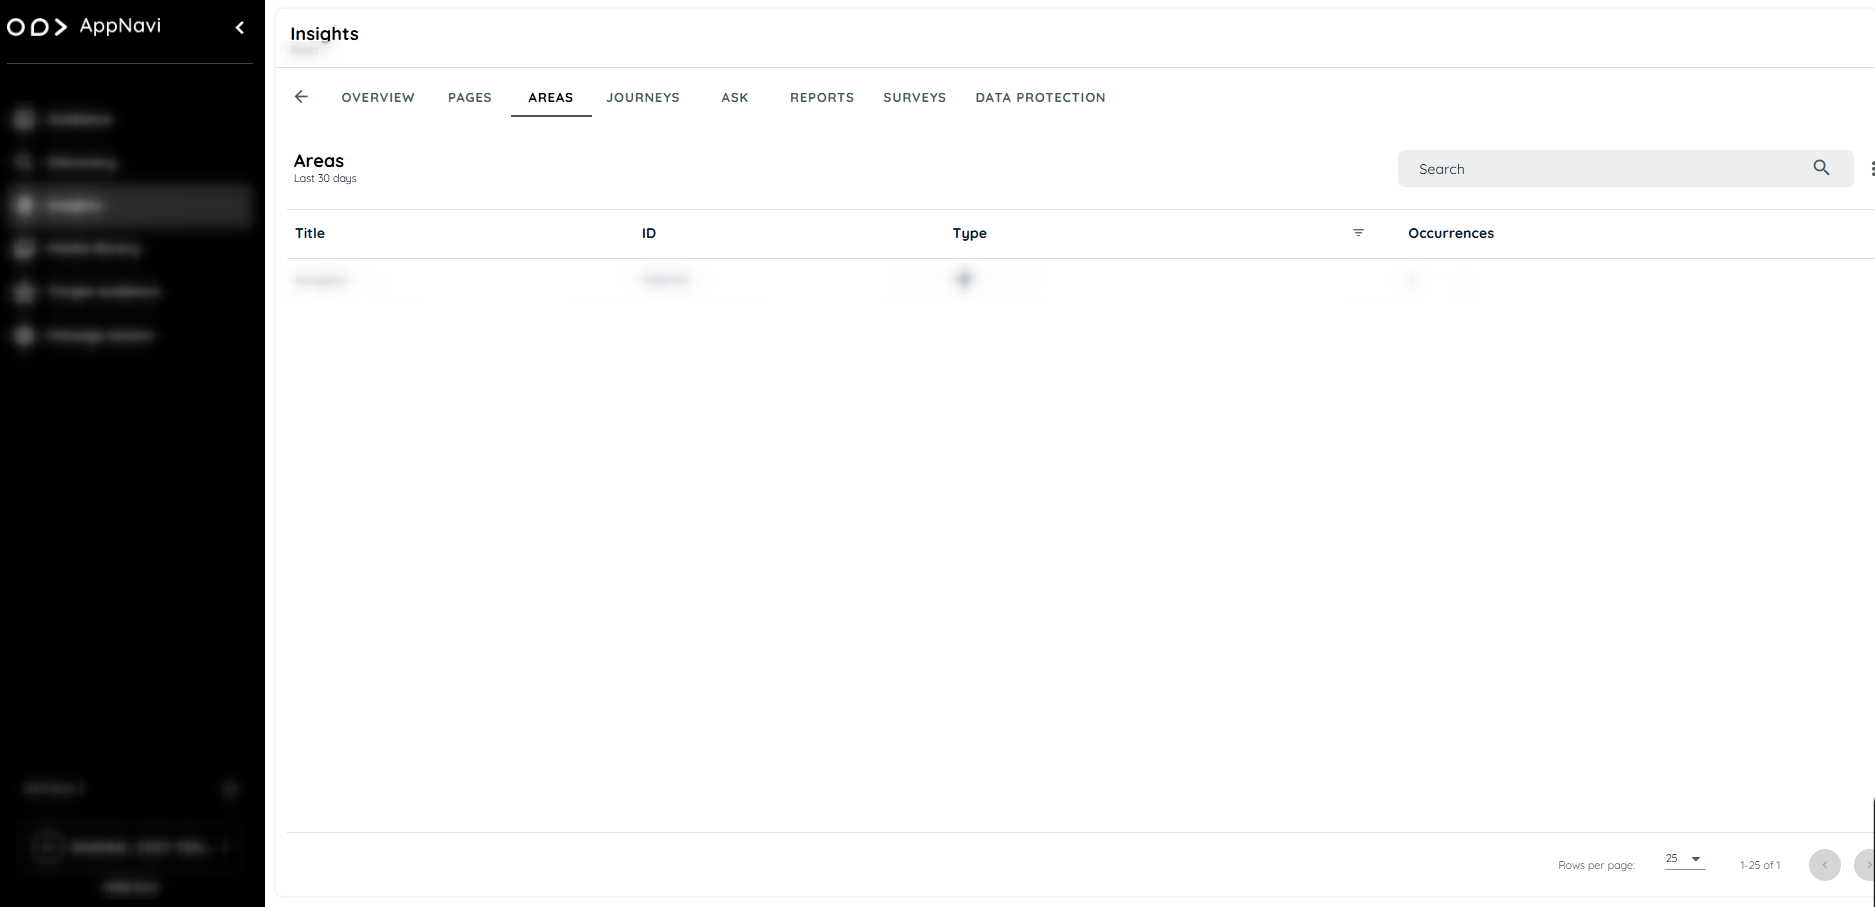
Area Tab
Click on the three-dot button menu it will show the actions:
Actions in the Areas Tab
- Refresh: Updates the data to reflect the latest interactions.
- Download Data: Exports the area data to an Excel sheet for further analysis.
Filtering Views: Users can adjust the data view to analyze interactions over specific time frames:
- Last 30 Days
- Last 90 Days
- All-Time
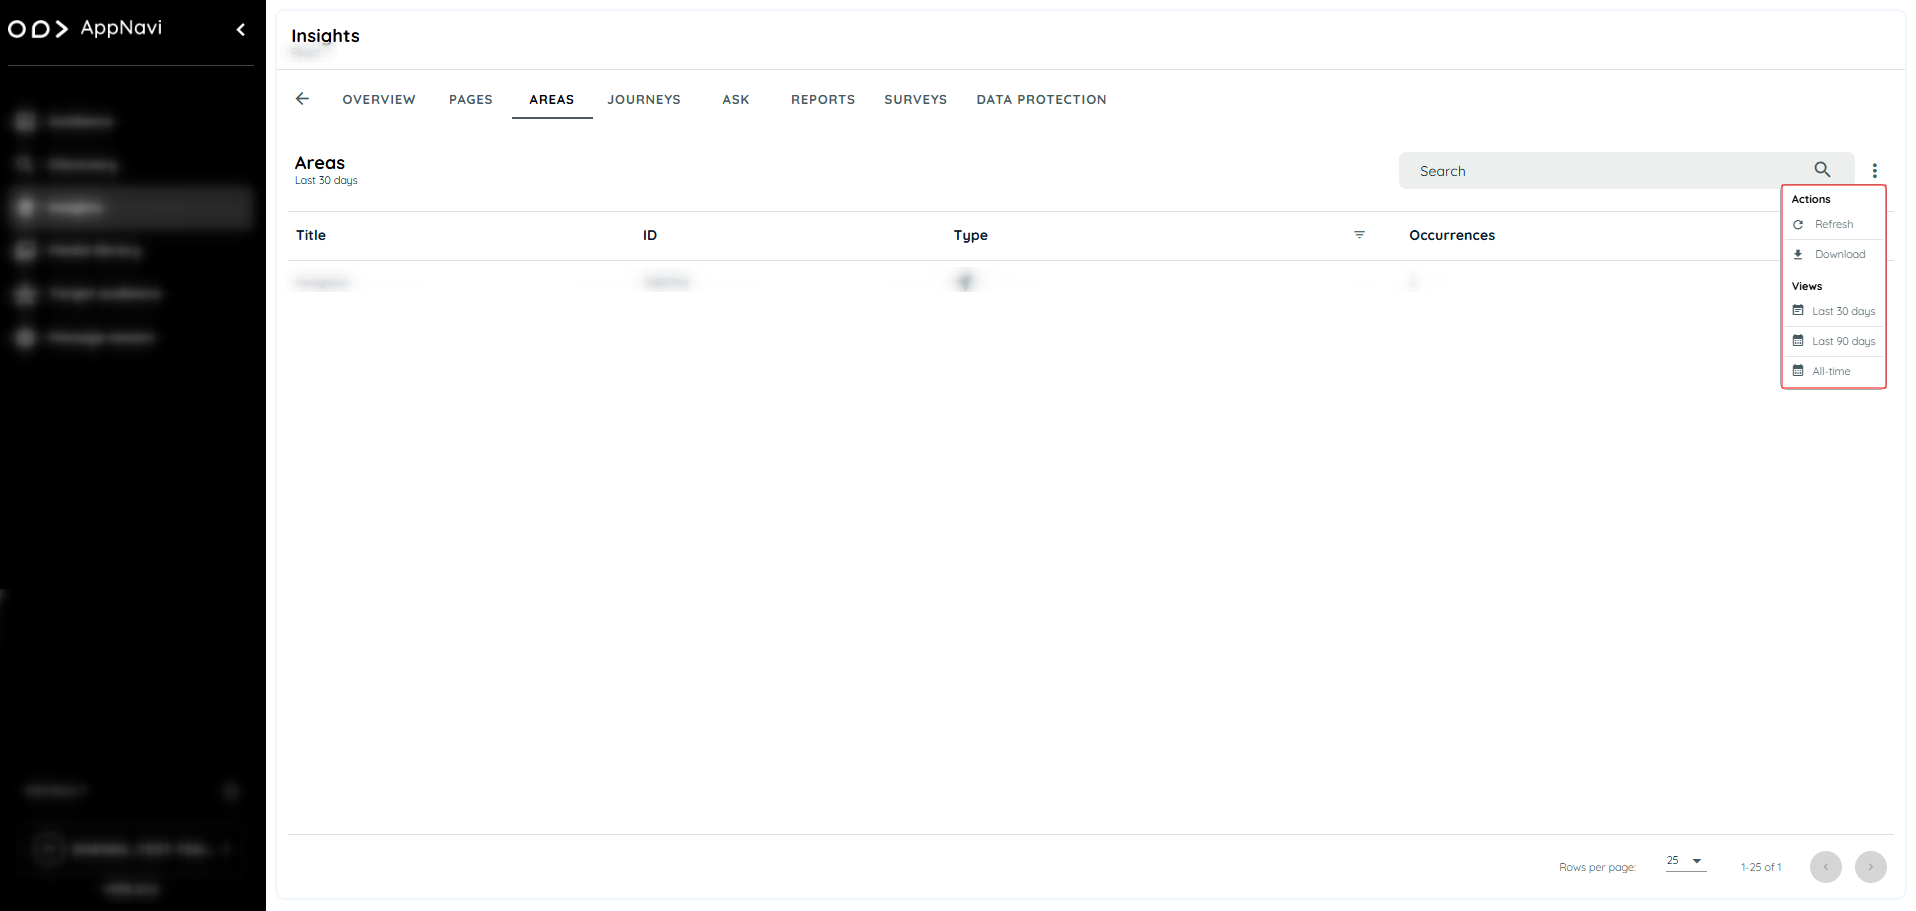
Action & Views
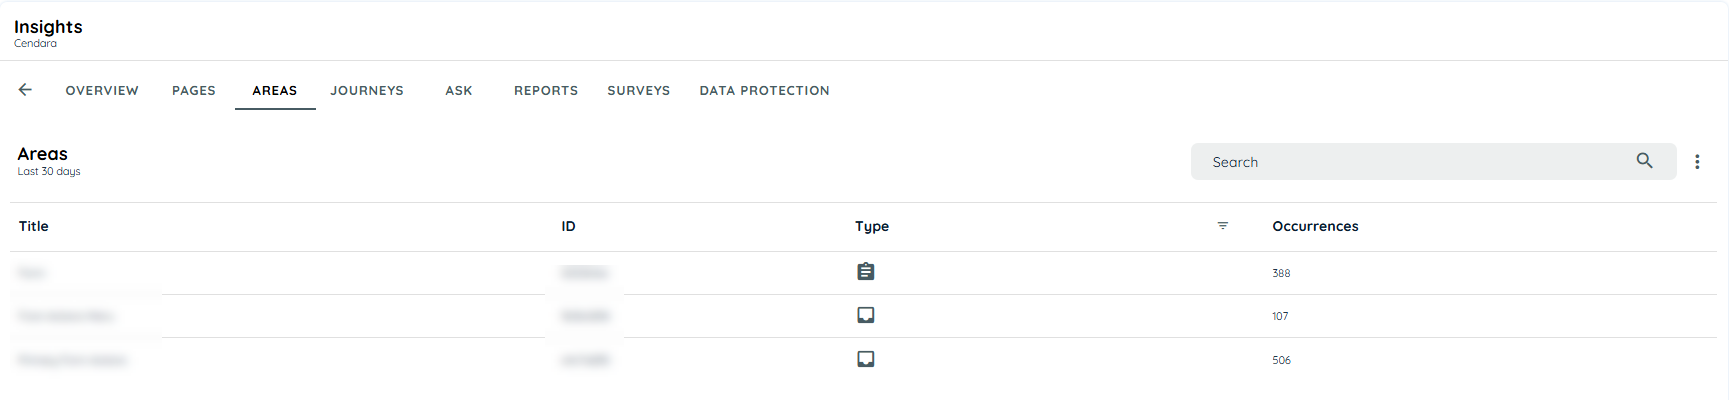
Area Table Overview
The Area Table displays an organized view of each area with several key columns. This table includes:
- Title: The area title, derived from the area definition.
- ID: The unique identifier for the area, also sourced from the area definition.
- Type: Type of area (Container, Table, Navigation, Form).
- Occurrence: The number of distinct instances identified for each area element.
Area Analytics Overview
Clicking on an area in the Area Table opens the Area Overview, displaying key data points for that specific area, including:
- URL: The URL pattern associated with the area.
- Left Click: The total number of left-click interactions within the area.
- Right Click: The total number of right-click interactions within the area.
- Users: The total number of users who interacted with the area.
- Activity Time: The average time users spent interacting within the area.
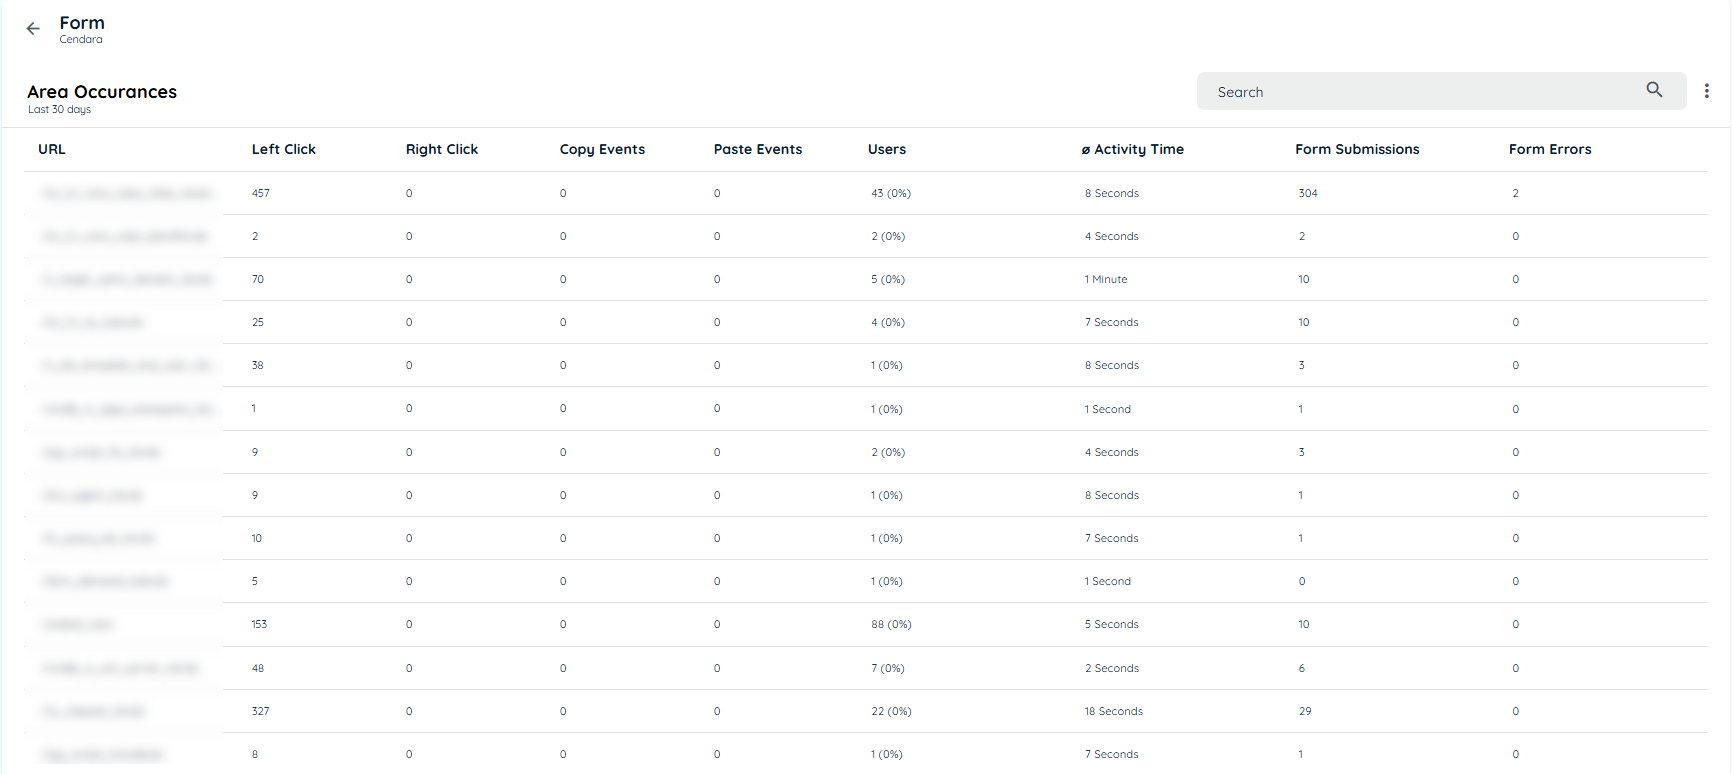
Detailed Analytics
Users can click a URL to view detailed analytics, including:
- User Activity Data
- Country-based Insights
- Trackable Elements and Interactions
Users can overview any URL and can check the interactions, the percentage and count of users interacting on that URL and the total activity time spent on that element.
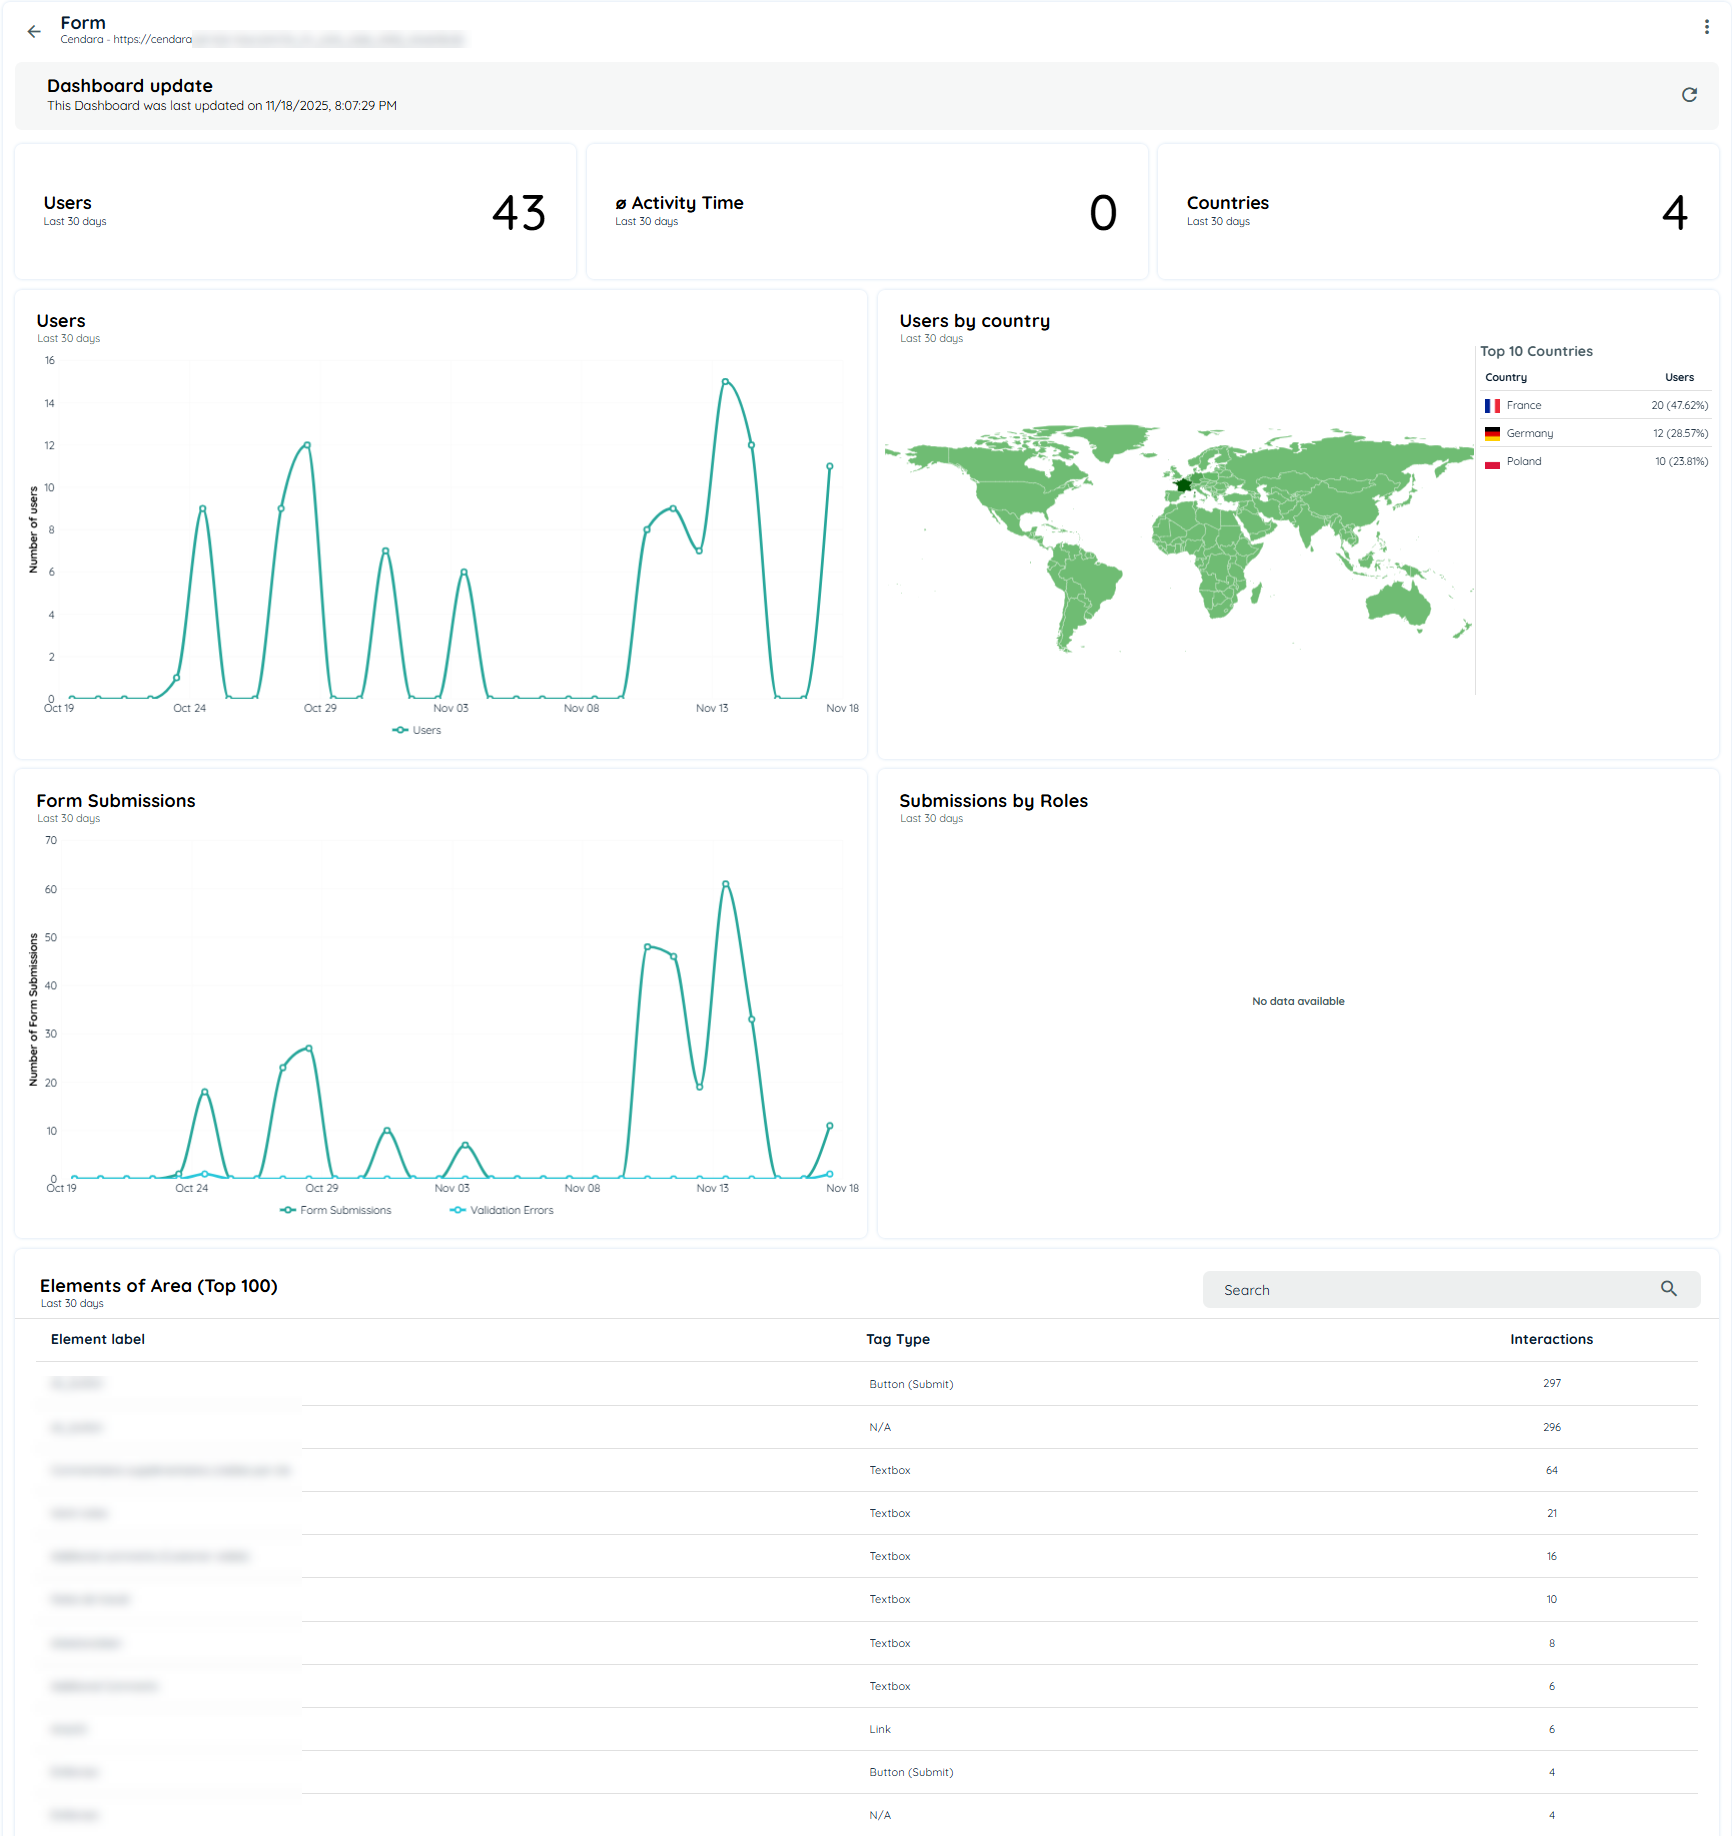
Users can view the detailed analytics of any element by clicking on the URL and the detailed analytics tab will appear with all details of the users, activity time, countries and the interacted trackable elements.
Conclusion
The Areas feature in Insights provides organizations with detailed engagement metrics to track and optimize user interactions. By configuring and analyzing areas effectively.
Updated 8 months ago