Discovered Apps Overview
Discovered Apps Overview
The Discovered Apps section under the Discovery tab offers a comprehensive view of all applications detected within the organization that have 10 or more users. It is designed to support analysis, categorization, and decision-making based on user activity data.
Access and setup of Discovered Apps
Use the following path to open the application inventory. The same path also gives you access to the Company Apps and Shadow Apps views.
-
Open the Portal.
-
Navigate to the Discovery tab.
-
Open App Overview.
-
At the top of the page, choose Discovered Apps, Company Apps, or Shadow Apps.
-
Select Discovered Apps to open the application inventory table.
Before reviewing results, confirm the selected time period and the country, organizational unit, and department filters. These choices determine the population represented by the table and dashboard.
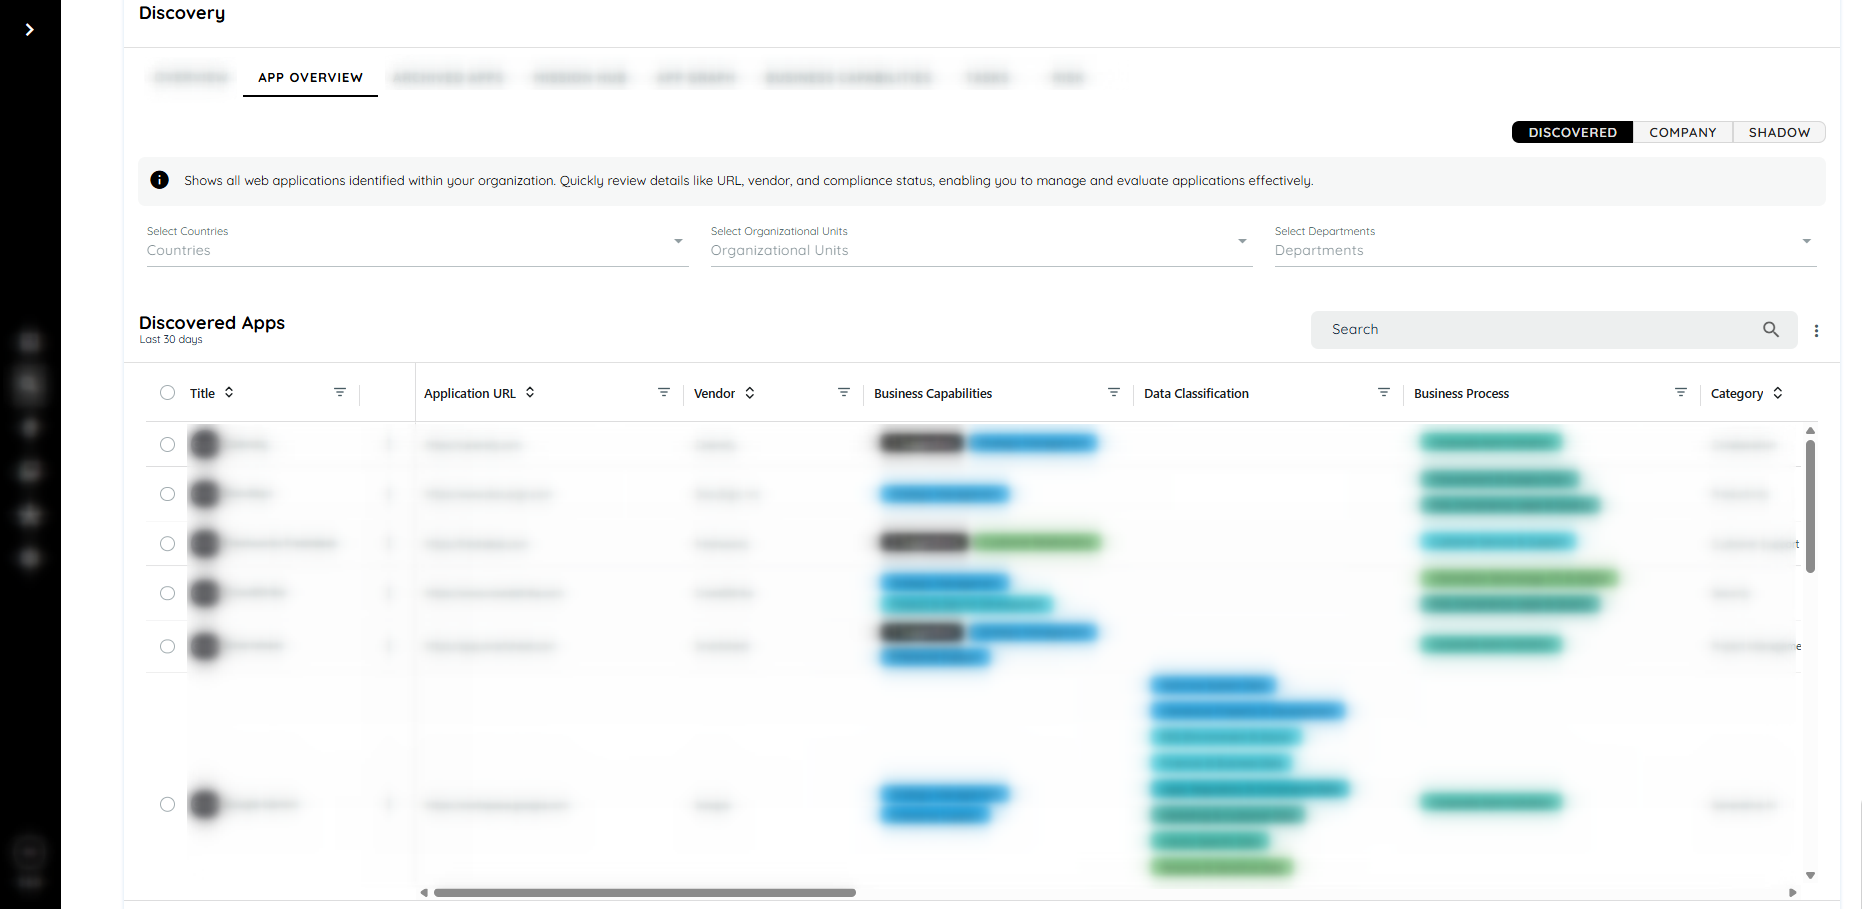
App Overview and Discovered Apps table
What to look for. The filter bar is above the table. The table begins below the time-period label and includes application identity, ownership, capability, classification, and usage fields. The three-dot menu at the right of the search field provides application-level actions.
Table Overview
The Discovered Apps table is powered by AG Grid, offering a high-performance and interactive experience:
- Sticky Title Column: The Title column remains fixed during horizontal scrolling.
- Filters: Each column supports advanced filtering using operators such as:
- Equal To
- Exists
- Contains
- Begins With
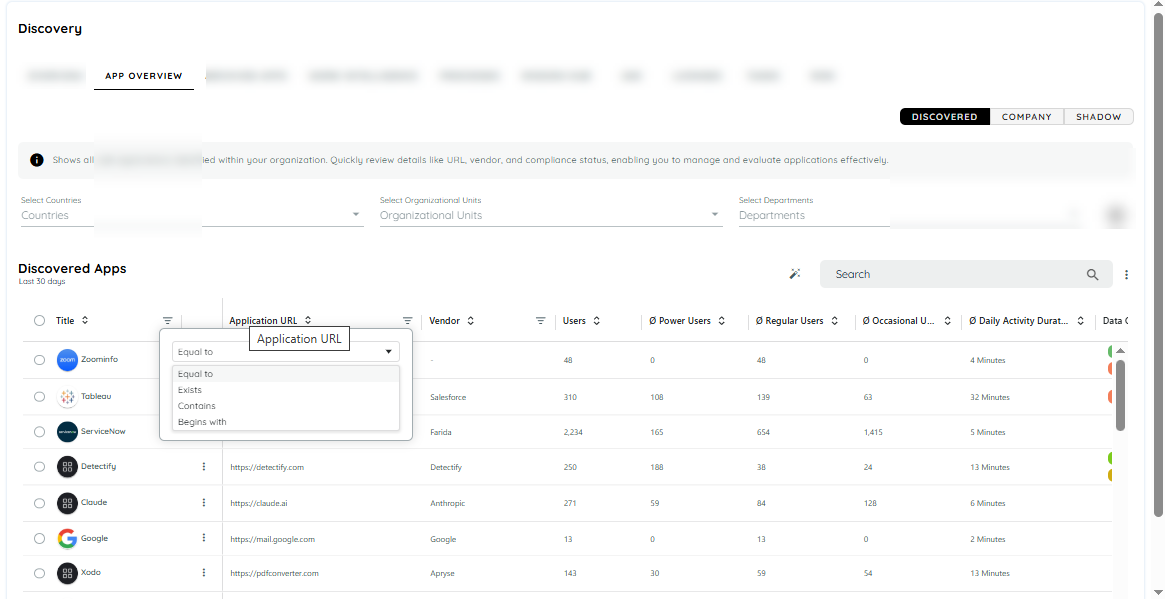
Filter menu in the Discovered Apps table
Column Removal: Dragging a column outside the grid removes it from the current view. Refreshing the page restores the original layout.
Data collected and table meaning
Discovered Apps provides a view of web applications detected within the organization that meet the current discovery threshold of 10 or more users. The table supports sorting, searching, column filters, horizontal scrolling, and temporary column removal.
| Field | Meaning |
|---|---|
| Application | The application URL. |
| Title | The editable application title. |
| Capability | The assigned business capability based on the application URL. |
| Users | The total number of users associated with the application in the selected scope. |
| Type | The application category assigned by the configured rules. |
| Activity Time | Total active usage time over the last 30 days. |
| Copy Count | The number of copy events. |
| Paste Count | The number of paste events. |
| First Seen | The date on which the application was first discovered. |
| Last Seen | The date of the most recent activity. |
Application type rules
| Type | Rule or interpretation |
|---|---|
| SaaS | An application linked to a business capability. |
| Standard Software | An application URL that starts with www. and contains more than two dots. |
| Others | An application that does not fit another configured category. |
| Customer Built | An application category set manually by a user. |
Time periods and exports
Use the time-period selector to define the reporting window for the metrics shown in the table and in exported results.
| Time period | When to use it |
|---|---|
| Last 30 Days | Review recent application activity. |
| Last 90 Days | Compare a broader recent usage pattern. |
| All Time | Review the complete discovery history available to the tenant. |
| Custom Date Range | Define a specific reporting window. The minimum range is 14 days. |
Metric and export behavior
- Changing the time period updates the metrics shown in the table and the data included in exported results.
- The time period does not change the total number of applications shown in the inventory.
- If an application has no data in the selected range, its Analytics option is not available.
- To export a reproducible result, select the required time period and top-level filters first, verify the table and metrics, and then use the export action available in the App Overview toolbar. The exported result should be interpreted using the same filter and time-period selections.
Filters and dashboard meaning
The top-level filters define the user population used for the application list and related analytics. The available filters are Country, Organizational Unit (OU), and Department.
How filter scope works
- When top-level filters are selected in App Overview, the same filter context is available in the Main Dashboard.
- The application list shows applications with users who satisfy the selected top-level filters.
- Related analytics and metrics update to reflect the selected filter scope.
- Search and column filters applied inside the grid are local to the App Overview list and are useful for temporary analysis. They do not redefine the wider dashboard population.
Dashboard interpretation
Use the dashboard to move from a filtered population to a summary of what that population is doing. The summary cards show counts for discovered applications, countries, and users. The Most Used Applications chart helps identify applications with the highest user counts, while Users by Country shows the geographic distribution for the selected scope.
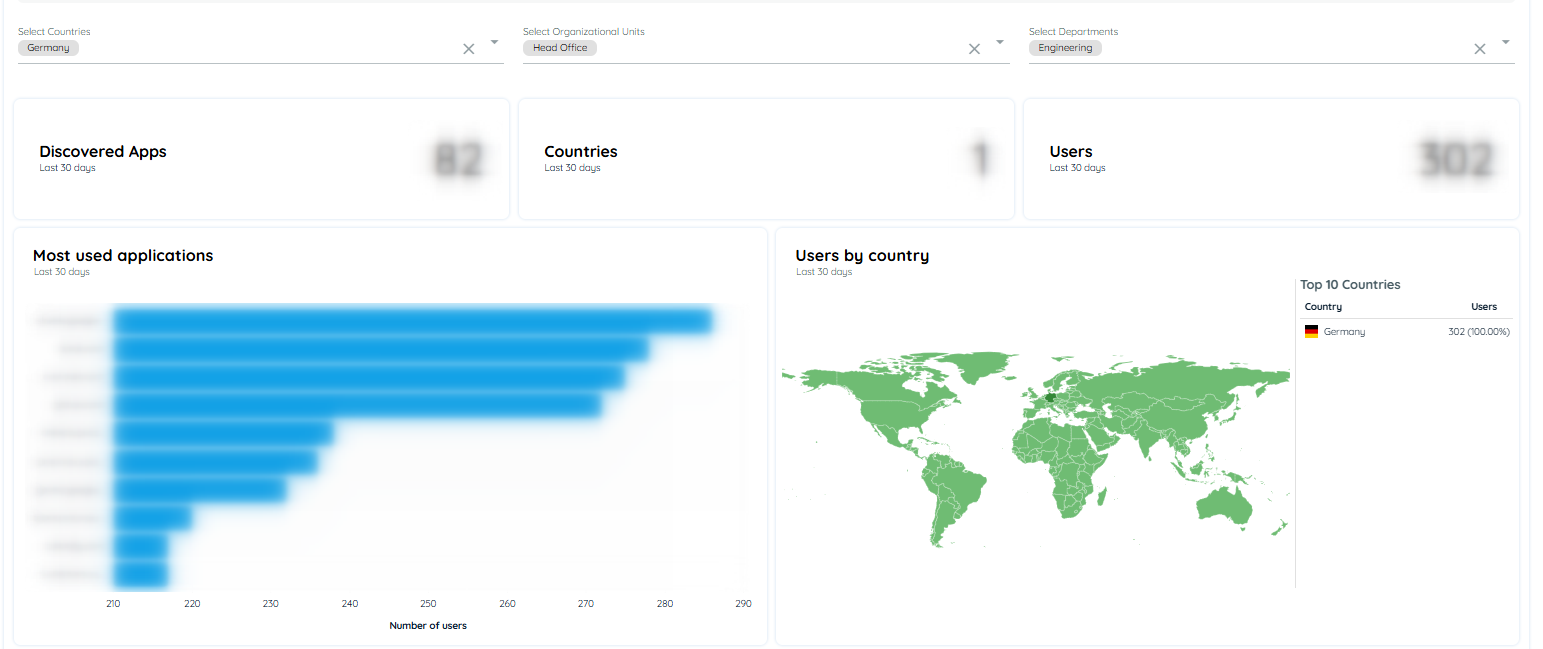
Dashboard metrics for a filtered user population
Example.
If Country is Germany, Organizational Unit is Head Office, and Department is Engineering, the App Overview table and related dashboard metrics represent that filtered subset rather than the full organization. Use the same selections when comparing an exported result with the dashboard.
Context Menu Options (Three-dot Menu)
The three-dot menu on an application row connects usage analysis with application governance. Use it after reviewing the application’s usage, ownership, capability, and risk context.
| Action | Purpose |
|---|---|
| Analytics | Open the detailed analytics view for the application. |
| Open App | Open the application URL in a new browser tab for verification. |
| Edit App | Update application metadata and governance settings. |
| Basic Settings | Update Title, Vendor, Type, Category, Privacy Policy, Terms of Service, and AppNavi application assignment. |
| Business Capability | Assign the application to one or more business capabilities. |
| Risk | Set compliance, security, and legal flags. |
Recommended review sequence
-
Use the filters and time period to define the population and reporting window.
-
Review the application’s user count, activity time, first seen date, and last seen date.
-
Open Analytics when the application needs a deeper usage review.
-
Open the application when you need to verify its identity or purpose.
-
Use Edit App to complete metadata, business capability, compliance, security, and legal fields that support the governance decision.
The page should help the reviewer move from “What is this application and how is it used?” to a documented decision about classification, capability ownership, risk status, or follow-up investigation.
Quick filtering with Magic Wand
Magic Wand lets users describe the required view in plain language. It can build matching filters, sorting, or visible-column changes for the application list without requiring each filter to be configured manually.
Where to find it
The Magic Wand icon is below the Discovery App Overview filters, to the left of the search bar, and directly above the application list. It is available for the Discovered, Company, and Shadow views.
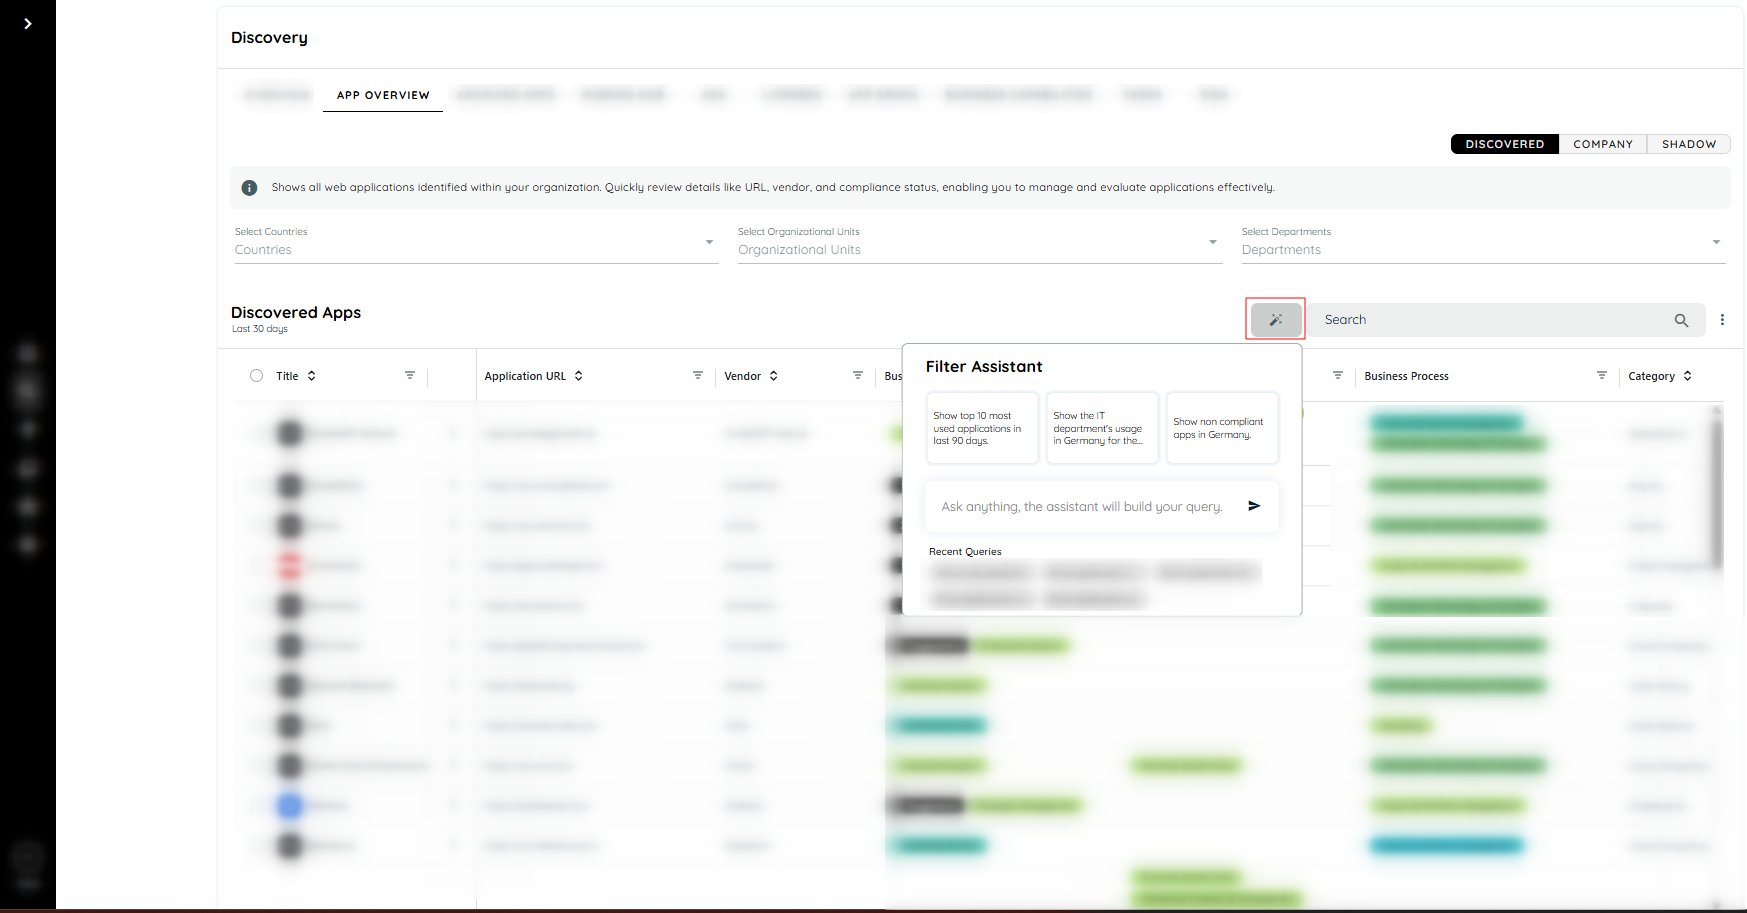
Magic Wand Filter Assistant
How to use it
-
Open Discovery and go to App Overview.
-
Choose Discovered, Company, or Shadow.
-
Select the Magic Wand icon above the application list.
-
Choose a default prompt or type a plain-language request.
-
Review the updated list. The assistant applies the matching filters, sort order, or visible columns.
Example prompts
| Goal | Example prompt |
|---|---|
| Find high-usage applications | Show applications with more than 100 users |
| Find recently used applications | Show applications used in the last 30 days |
| Find applications by department | Show applications used by Finance |
| Find top applications in a region | Show top 10 German applications sorted by users |
Magic Wand is most useful when the question is clear but the exact combination of filters is not. After it updates the list, review the resulting filter state before sharing or exporting the result.
Related documentation and next steps
Use the links below to move to the relevant section of this guide. In the published documentation portal, these same topic labels can also link to the corresponding setup, reports, SSO, Company Apps, and Shadow Apps pages.
Set up and open discovery views
Review reports, filters, and exports
Important interpretation notes
- The application count and metrics depend on the selected time period and top-level filters.
- A missing Analytics option means that the application has no data in the selected time range.
- If a filter value is not available in the tenant, confirm that the relevant user or organizational data has been collected before treating the result as zero usage.
- Use the figure captions and surrounding explanations when translating or reusing screenshots so that the UI state and the intended interpretation remain clear.
Updated 18 days ago