
Error Handling and Custom Event Dispatching
Introduction
This page shows how to capture client-side JavaScript errors in your web application, send them to AppNavi as a UBM custom event, and review them in an Insights report. Once errors are in a report, you can filter, save and download them to monitor the health of your application.re
Prerequisites:
• AppNavi is loaded in your web application, so that window.appnaviApi is available to your custom code.
• Insights is set up for your tenant. See Setup the Insights.
• You have access to the Reports tab under Insights.
Overview of the Steps
• Capture errors with a JavaScript error event listener.
• Send each error to AppNavi as a UBM custom event.
• Review the errors in an Insights report after the nightly job has run.
Why Capture Errors
Errors can disrupt the user experience. Administrators must be aware of these errors and respond to them efficiently. By capturing errors, you gain insights into problems users face and can resolve them quickly. This approach also allows you to classify errors and track them for reporting purposes.
Capturing Errors on the Client-Side
JavaScript provides a simple way to capture errors using the error event. You can listen for any errors occurring in your web application and handle them accordingly.
AppNavi provides push events to capture and transmit event data. For details, see.Push Event API
Example: Error Event Listener
Here’s a straightforward way to capture errors:
window.addEventListener("error", (event) => {
    // Log the error details
    console.error("Error captured:", event.message);

    // Classify the error (e.g., 'Error', 'Warning', or 'Info')
    let errorType = event.type == "error" ? "Error" : "Warning";

    // Send error details via the custom event API
    let ubmEvent = {
        eventType: "CUSTOM:error_event",
        customField_1: `Message: ${event.message}`,
        customField_2: `Source: ${event.filename}`,
        customField_3: `Type: ${errorType}`
    };

    window.appnaviApi.analytics.pushEvent({ type: "ubm", events: [ubmEvent] });
});
In this example:
- The error event is captured and classified as either an
Erroror aWarning. - A
ubmcustom event is triggered, sending the error details to the reporting system.
Sending Errors with the UBM Custom Event API
You can use the ubm custom event API to send error logs, making it easy to monitor and analyze errors. Only three fields are used to keep the data simple and concise.
Example: UBM Custom Event
This snippet is the part of the listener above that builds and sends the event. It uses the event and errorType values from the listener.
let ubmEvent = {
    eventType: "CUSTOM:error_event",
    customField_1: `Message: ${event.message}`,
    customField_2: `Source: ${event.filename}`,
    customField_3: `Type: ${errorType}`
};

window.appnaviApi.analytics.pushEvent({ type: "ubm", events: [ubmEvent] });
In this event:
customField_1: Describes the error message.customField_2: Shows where the error occurred (the source file).customField_3: Specifies the type of error (e.g.,ErrororWarning).
View Errors in Report
Captured errors appear in Insights reports after the nightly job has run, so new errors may take up to a day to show up. For more about reports, see Reports
To create a report of captured errors:
- Go to the Reports tab under Insights within the application.
- Click the + icon to create a new report.
- Enter a suitable title and description for the report.

The Report Overview page. Enter the report title and description in the Basic section.
- In the Results section, click the menu (burger) icon at the top right.
- Under Structure, select the following attributes:
Event Type
Custom Field 1
Custom Field 2
Custom Field 3
(These fields have been added via custom code to track events. Users may select additional attributes as needed.) - Click Filters to define the report parameters.
- Choose a date range corresponding to the time the custom code was added to the application.
- In the Attributes section, select Event Type.
- Set the Condition to "contains" for accurate filtering.
- Enter the value "error_event" (this is the event type name defined in the custom code).
- Click Apply to view the filtered results.
- The report will now display all errors captured by the custom code.
- Click save changes to save the created report.
- Optionally, download the report for further analysis.
Result: the report lists every error captured by the custom code. Each row shows the event type CUSTOM:error_event, and the custom fields show the error message, source file and error type.
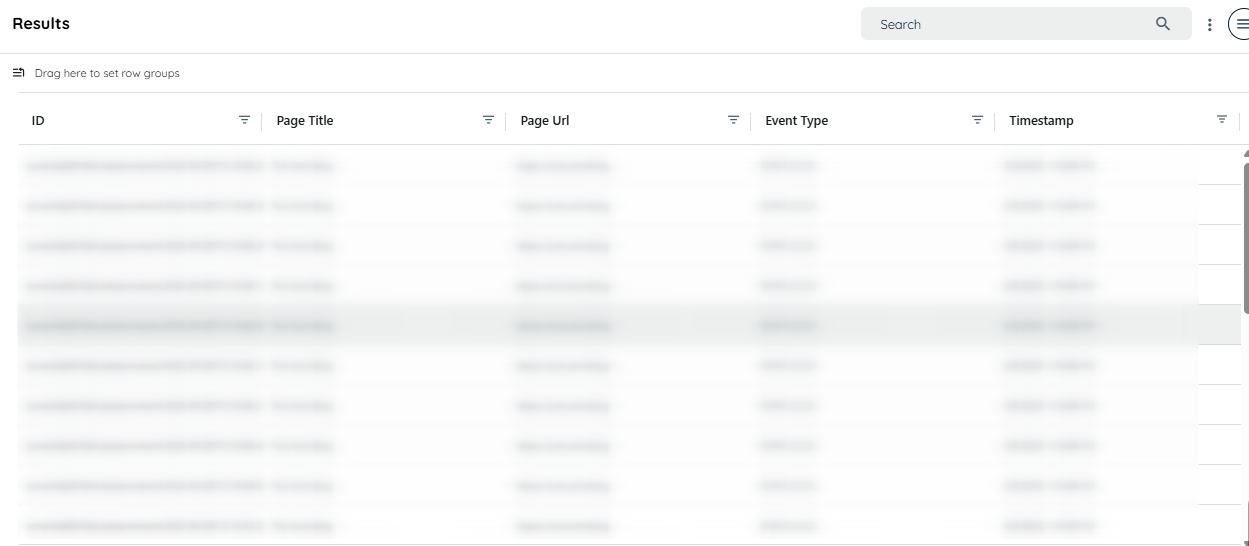
The Results section of the report.
Limitation: Errors That Can't Be Recognized
While client-side error capturing is powerful, it's important to understand its limitations. Not all errors can be detected using the error event listener:
Silent Failures (No Error Thrown)
Errors that do not throw exceptions, such as logic errors or incorrect application state, will not trigger the error event. For example, if a function fails to update the UI but doesn't throw an error, it won’t be captured.
Network Failures
Some network-related errors (e.g., failed API requests) might not trigger a standard error event. In such cases, you'll need to handle errors using promises and the catch method or within try-catch blocks.
CORS-Restricted Scripts
If the error occurs in a script from a different domain without proper CORS headers, the error details might be obscured for security reasons. The event will still be triggered, but the message may read "Script error" with no additional details provided.
Non-JavaScript Errors
Errors that occur outside of the JavaScript runtime, such as server-side issues or backend problems, cannot be detected through this method. These require server-side logging and monitoring.
This limitation is important to keep in mind when implementing your error-tracking solution.
Conclusion
By capturing and classifying errors with the error event and sending them through the ubm custom event API, administrators can easily monitor and respond to issues in their applications. This method allows for efficient tracking and reporting, ensuring that errors are logged and analyzed promptly, leading to faster resolutions and a smoother user experience.
Updated 8 days ago