Journey View
What is Journey View?
Journey View is a feature that helps organizations track and analyze how users interact with an application. It visually represents user journeys, making it easy to understand behavior and improve user experience. With Journey View, organizations can:
- Monitor user interactions like clicking, navigating, copying, pasting, and searching.
- Identify areas where users face difficulties or drop off.
- Improve workflows by analyzing engagement patterns.
- Track how many users interact with the same elements.
Why Use Journey View?
Organizations need Journey View to gain insights into user behavior, helping them make better decisions to enhance their applications. It helps by:
- Showing how users move through the application.
- Identifying problems in navigation or usability.
- Highlighting frequently used and ignored sections.
- Improving user experience based on real data.
How Journey View Solves Problems
Many organizations face challenges when trying to improve their applications. Journey View solves these problems by:
- Providing Clear Insights: Tenant owner can see where users click, how they navigate, and what they interact with.
- Enhancing User Experience: By understanding user behavior, organizations can make applications more intuitive and user-friendly.
- Boosting Engagement: If organizations know what users like, they can make better decisions to keep them engaged.
How Journey View Works
Journey View records and visualizes:
- Start and End Sessions: Identifies where users begin and finish their journey.
- Time Spent: Tracks how long users engage within an application.
- Navigation Flow: Shows the movement path users take.
- Interaction Events: Captures Left Click, Right Click, Copy, Paste, and Search actions.
- User Interaction Density: Highlights areas with high user engagement.
Clicking on any journey opens the Info Tab, which provides insights into:
- Users: The total number of unique users.
- Sessions: The number of active user sessions.
- Avg. Load Time: The average time required for pages or areas to load.
- Avg. Time Spent: The duration users spend on a particular page or area.
How to Configure Journey View
To enable Journey View, follow these steps:
- Ensure an Insights Contract: The organization must have an Insights contract.
- Assign Insights to an Application: Once the contract is in place, assign it to the relevant application.
- Enable Insights Recording: Go to the Insights tab, open the application's settings, and turn on recording.
- Activate Automatic Tracking: Basic settings include automatic tracking options. Enabling these toggles allows tracking of:
- Page Tracking: Records user visits to different pages.
- Page Activity Tracking: Captures actions on pages.
- Table Tracking: Tracks interactions with tables.
- Form Tracking: Monitors form entries and interactions.
- Navigation Tracking: Logs user movement within the application.
- Copy & Paste Tracking: Detects when users copy and paste content.
Overview
The Journey View is a canvas-based structural format for visualizing journey data. It displays data in a diagram format, showing start and end sessions, the time spent on the journey, and arrow pointers indicating the journey's flow from start to end. Clicking on any journey opens the info tab, which shows detailed journey information including Users, Sessions, Avg. Load Time, Avg. Time Spent, Left Click, Right Click, Copy Events, Paste Events.
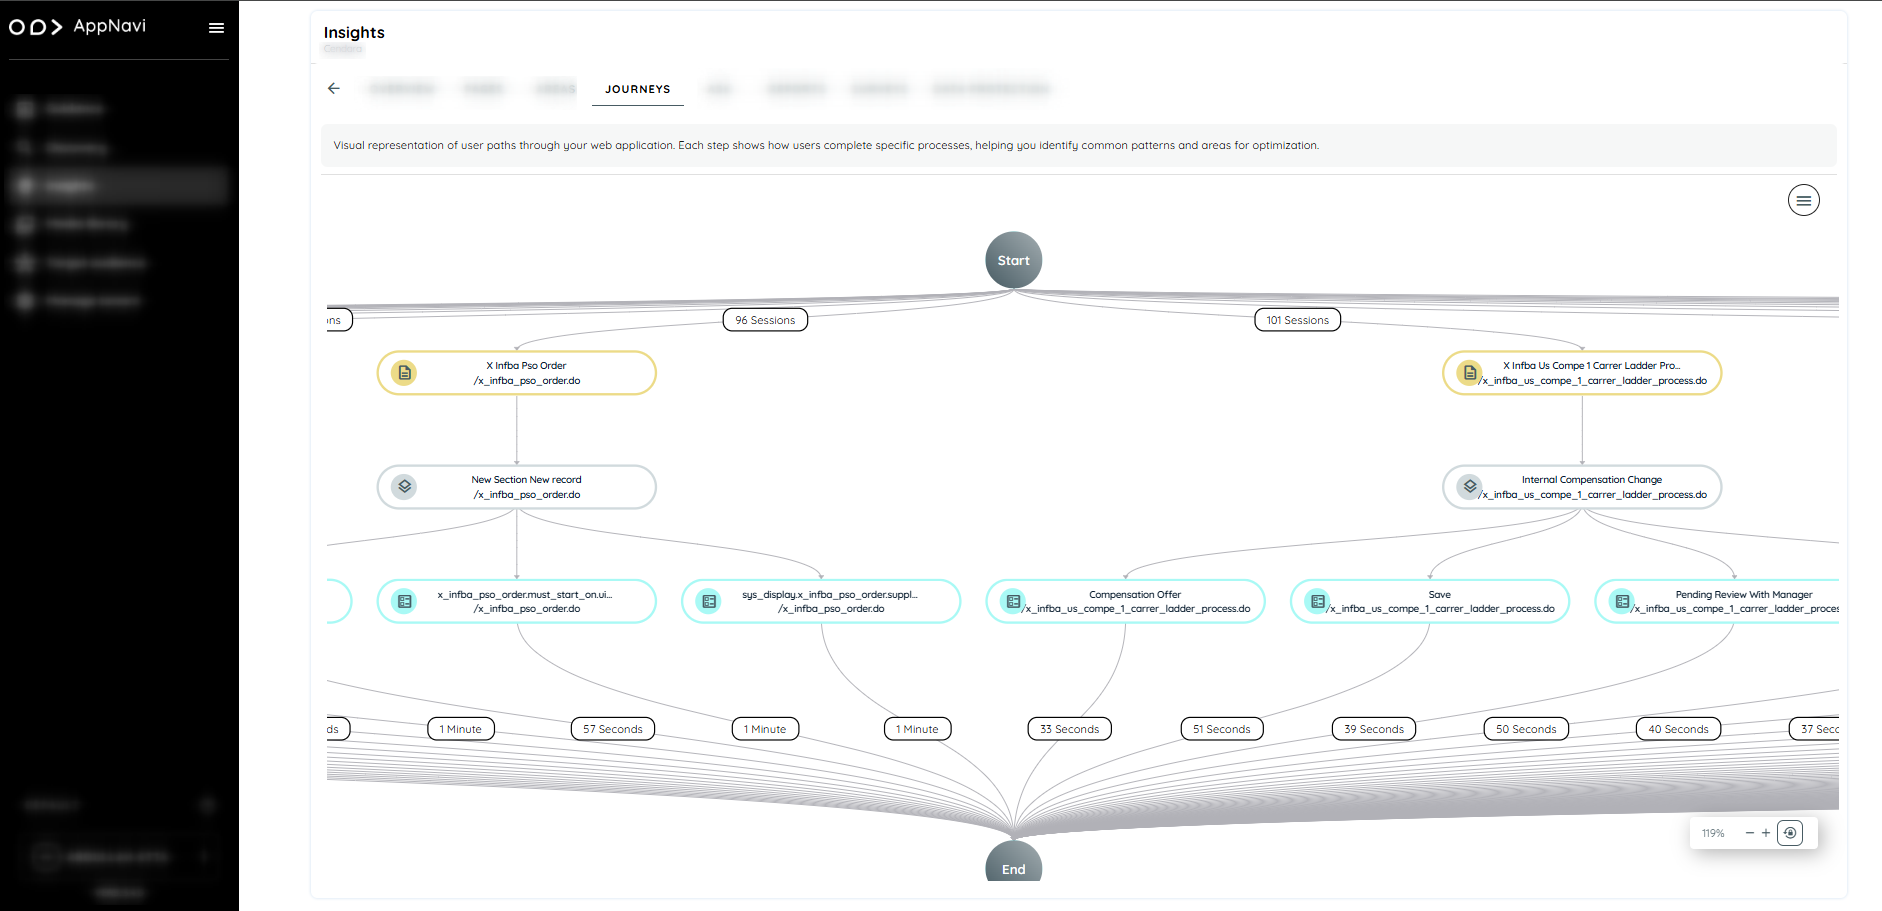
Journey
The Journey View canvas includes a hamburger menu with four options:
- Filter
- Journey
- Configuration
- info
These features collectively offer a comprehensive and informative experience to help you gain valuable insights into user journeys and interactions. Journey View enables detailed analysis of user behavior, helping you understand how users navigate through different stages of their journeys. Use the following document to review Journey View in detail.
Side Menu
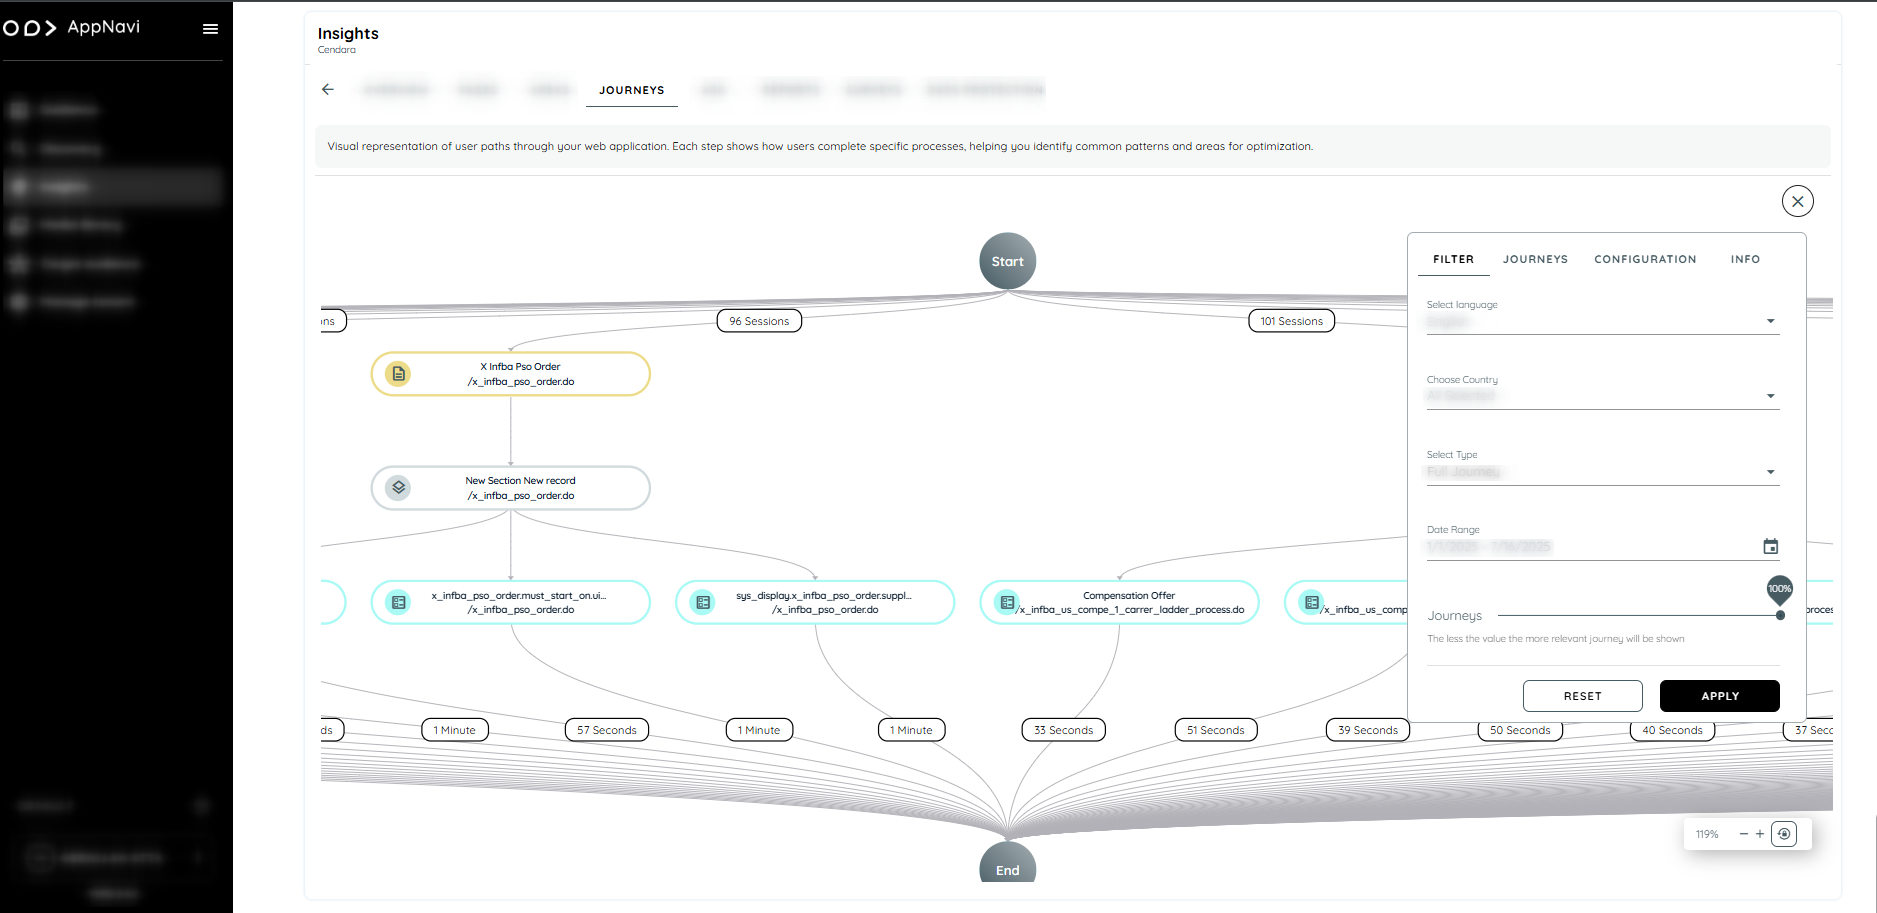
Filter:
- Select Language: Filters journeys based on the selected language.
- Select Country: Automatically selects countries based on the chosen language, but can be manually adjusted.
- Select Type: Choose between Full journey, Area Elemant, Area, or Page to filter journeys accordingly. To differentiate between them, all three types should be shown using different colors:
- Page = Yellow
- Area = Grey
- Element = blue.
- Select Date Range: Specify the start and end dates.
- Set Relevance / journeys: Use the slider to adjust journey relevance. Lower values show more relevant journeys.
- Apply Filters: Displays journeys that match the selected criteria, showing paths and rectangles with arrows.
- Reset Filter: Reset button will clear all the filter
Filter
Journeys:
Click on the journeys tab on the right side of the filters to see all journeys.
Master Button: Select or deselect all journeys.
Highlight Journeys: Hover over a journey to highlight it and its path.
Hide Journeys: Deselect a journey to hide it.
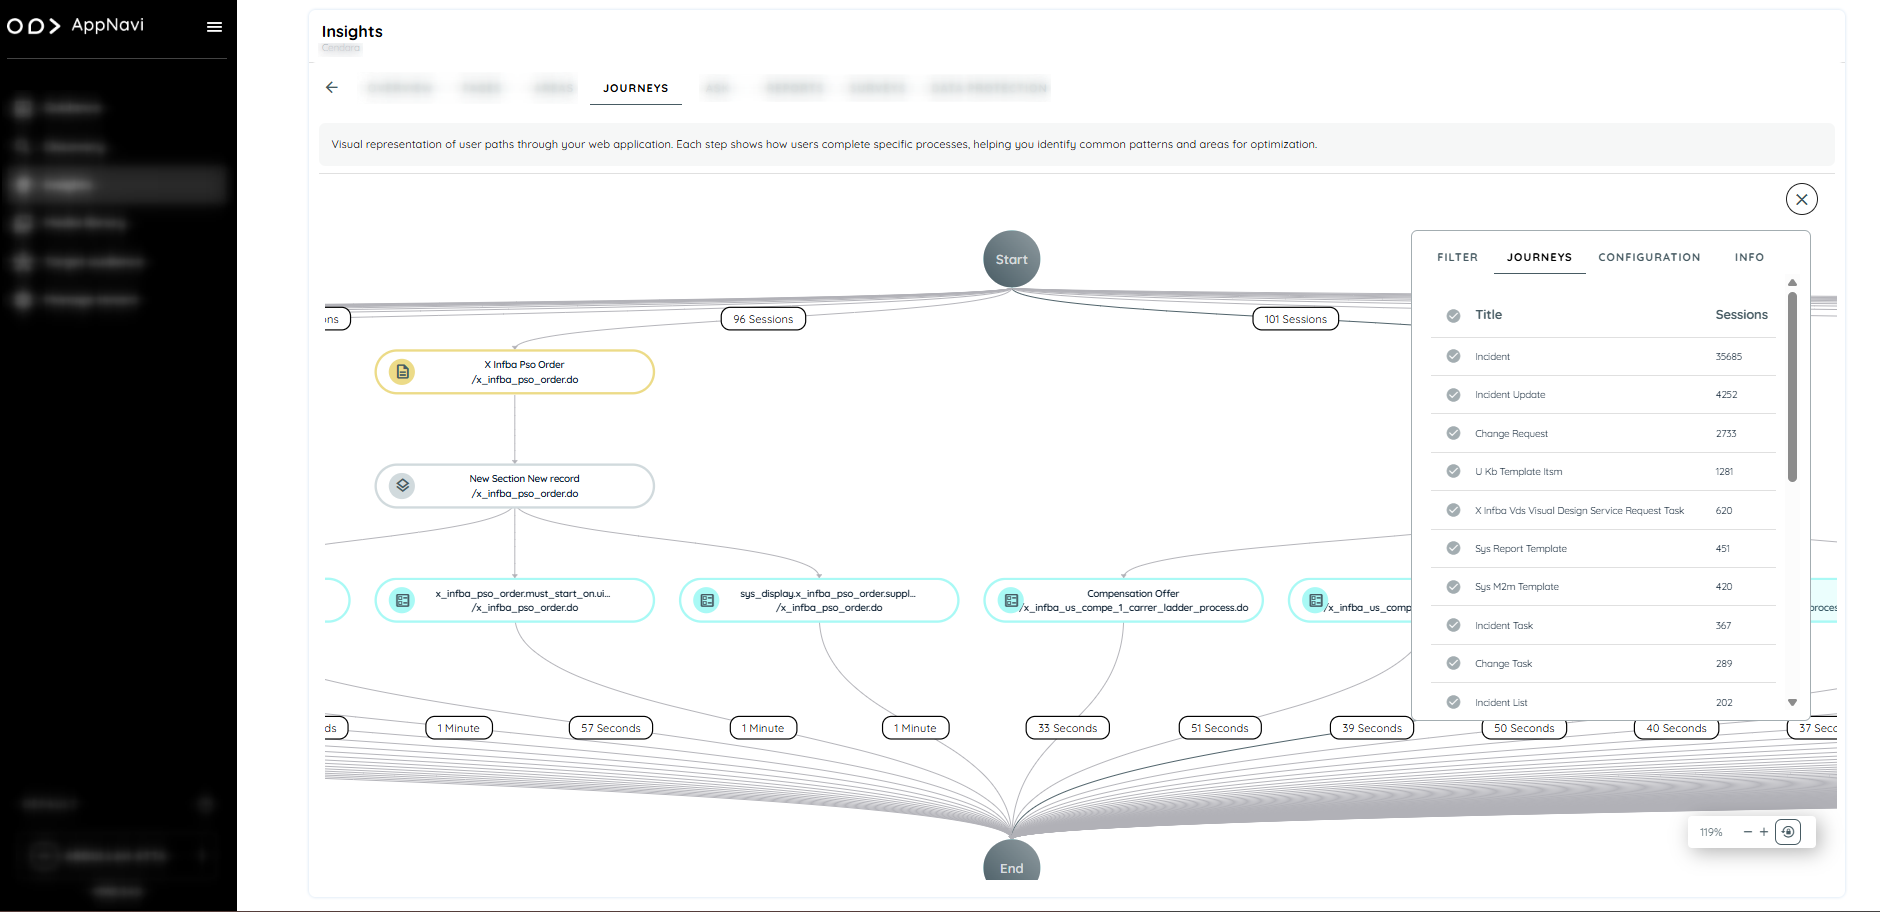
Journeys
Configuration
Click on the Configuration tab, located to the right-side of the Journeys tab, to set up metrics.
- Show Metrics: Displays rectangles with time and percentage metrics for the journey.
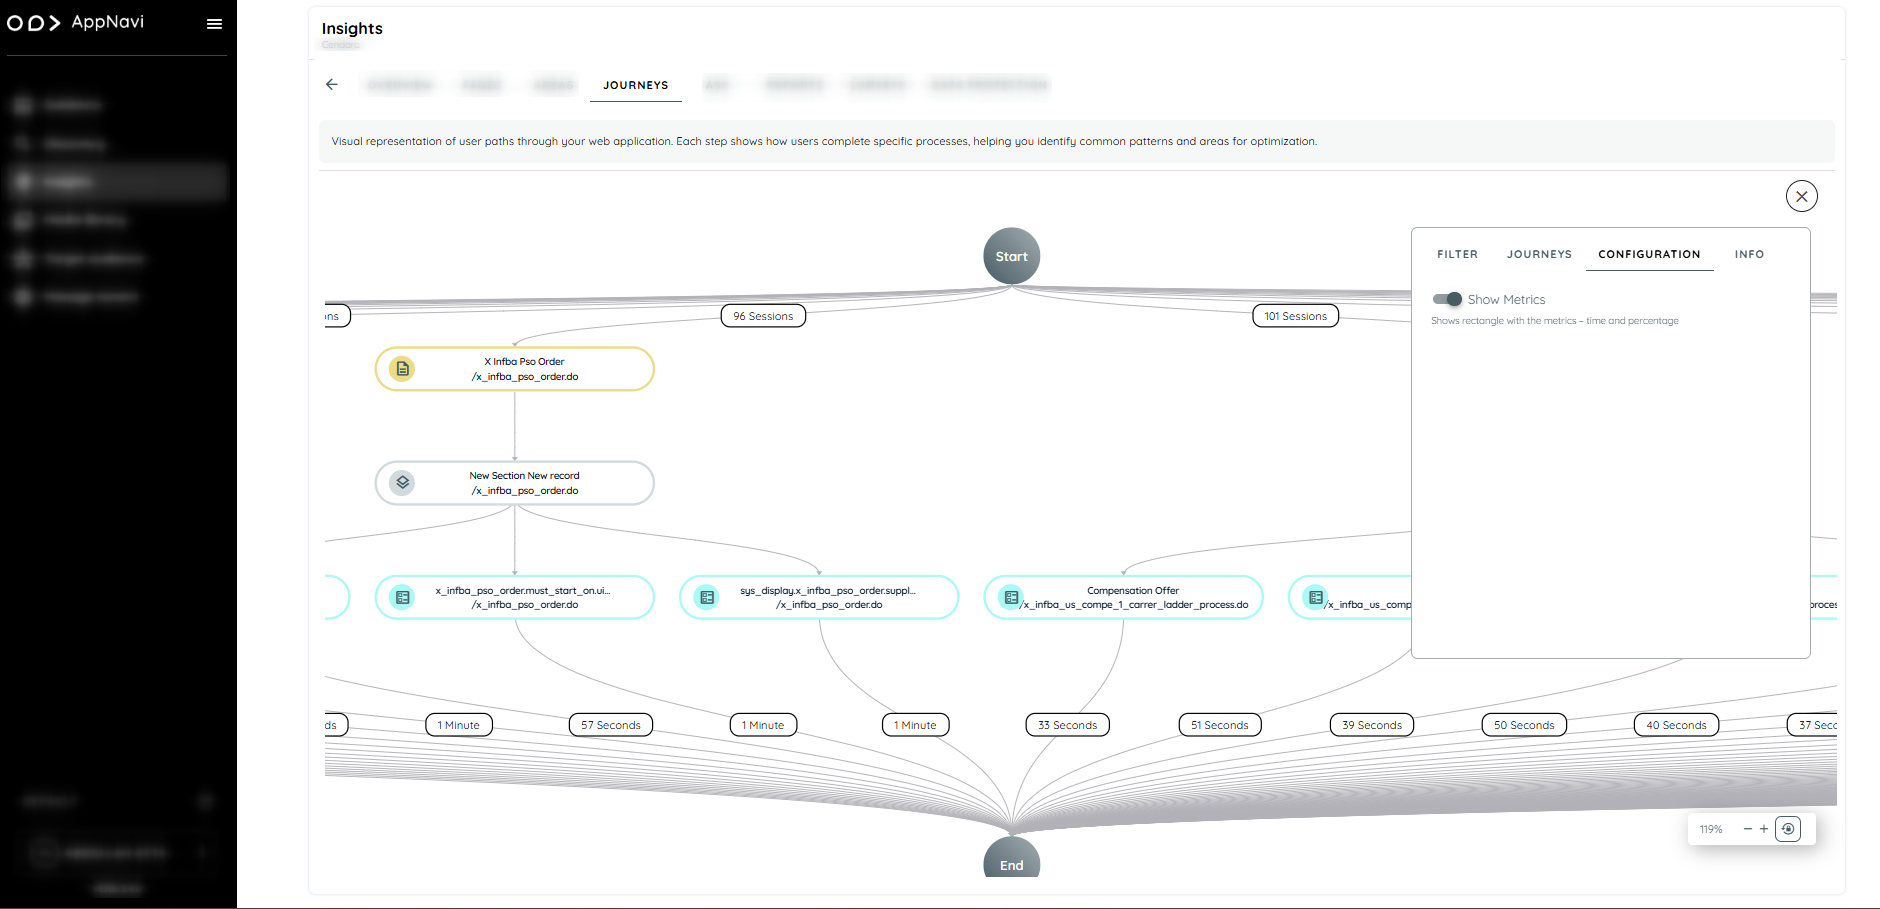
Configuration
Info
Clicking on any journey opens the info tab, where detailed data are available for analysis.
Page-Level Insights
When clicking on a page, the info tab opens to show comprehensive user engagement metrics, such as:
- Users: Total number of users interacting with the page.
- Sessions: Number of active sessions on the page.
- Avg. Load Time: Average loading time for the page.
- Avg. Time Spent: Average duration users spend on the page.
- Left Click & Right Click: Total counts for these interactions.
- Copy & Paste Events: Instances of text or content being copied from or pasted into the area
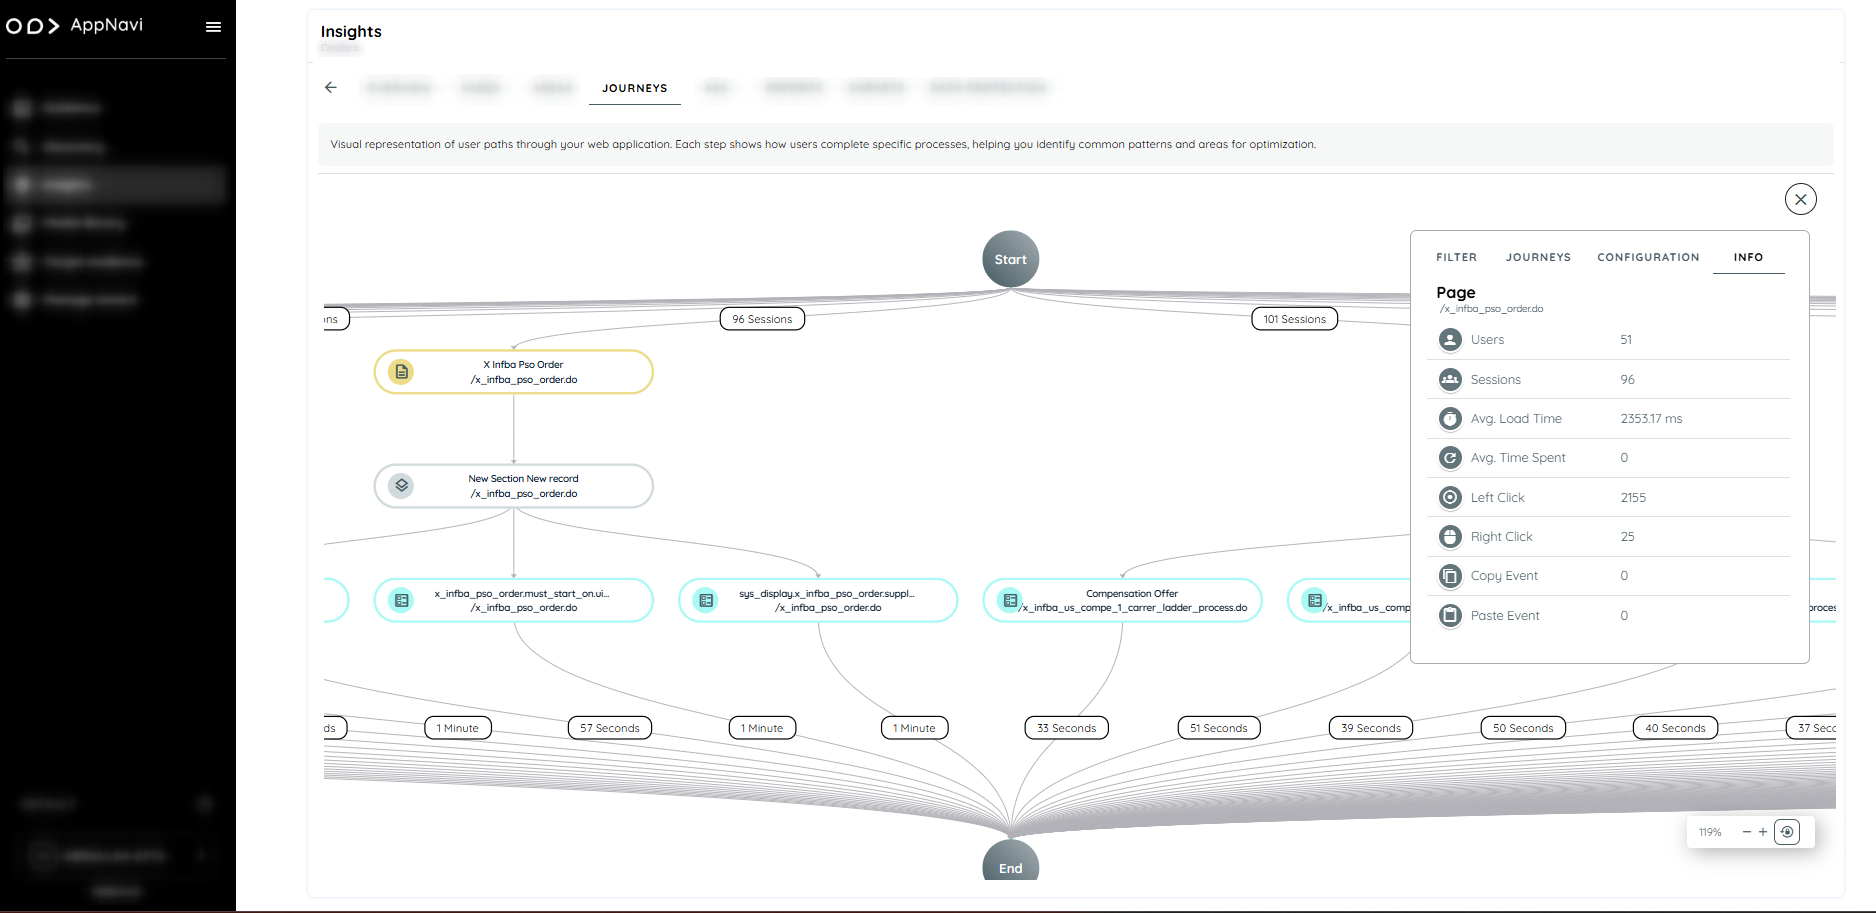
Page Level Insights
Area-Level Insights
When clicking on an area within a page, the info tab displays focused metrics like:
- Users and Sessions: User count and number of active sessions in the selected area.
- Copy & Paste Events: Instances of text or content being copied from or pasted into the area.
- Avg. Time Spent: Average time users spend interacting with the area.

Area Level Insights
Element-Level Insights
Clicking on a specific element within an area reveals interaction-focused details, including:
- Users: Count of users who engaged with the element.
- Interactions: Total engagement events with the element.
- Sessions (100%): Percentage representation of sessions that include this element.
- Left Click & Right Click: Total left and right clicks recorded.
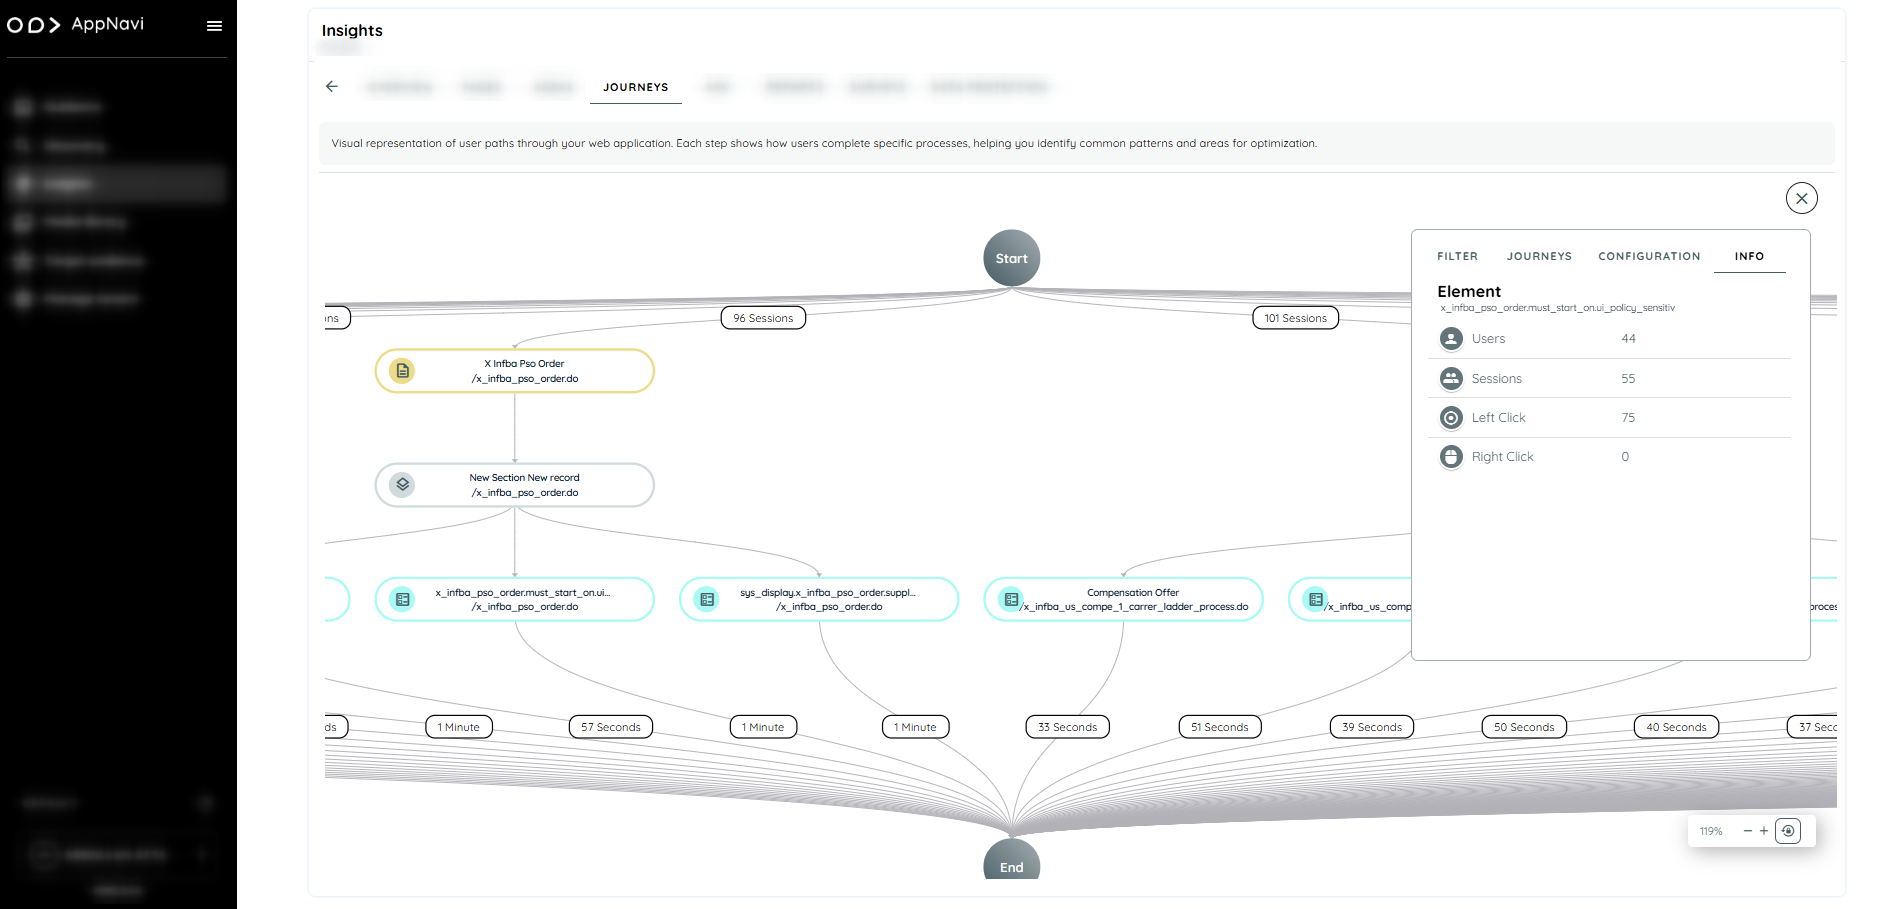
Element Level Insights
Journey Overview
Clicking outside any specific page, area, or element provides a high-level overview of the user journey in the info tab, presenting:
- Journeys: Total journey paths users take across pages and areas.
- Sessions: Number of active sessions within the journey.
- Users: Overall user count participating in these journeys.

Overview
Conclusion
The Journey View is an essential tool for businesses and application owners who want to understand user behavior and improve their platform. By analyzing how users interact with different parts of an application, businesses can create smoother, more efficient, and user-friendly experiences.
By leveraging Journey View, businesses can ensure a better, more engaging, and conversion-friendly user journey.
Updated 9 months ago