AppGraph
Overview:
App Graph provides a visual representation of user activities across multiple applications, capturing data on how users switch between tabs and applications. For instance, when a user moves from Google to Gmail, an API call records this transition, marking the activated tab as Gmail and the previous Page URL as Google. App Graph can track up to 25 tab switches and generate a hierarchical graph to show how users navigate across websites.
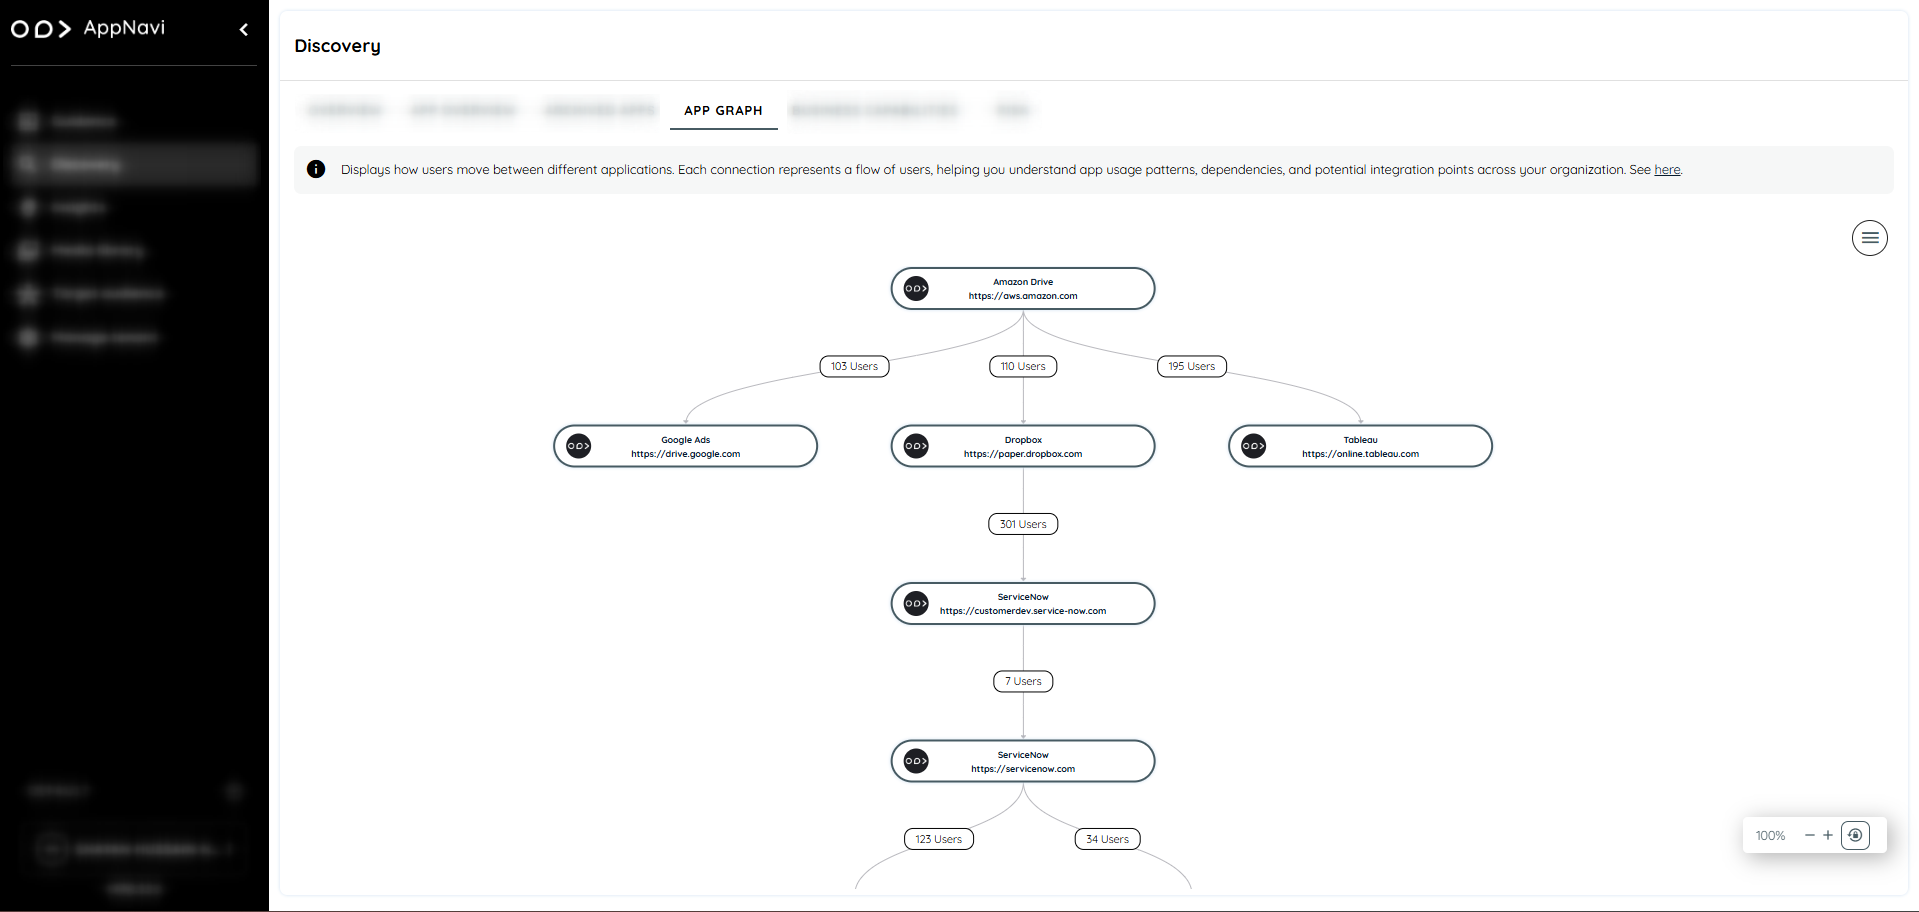
App Graph Visualization and Data Recording
To record and visualize user activity across different websites in App Graph, Tenant owner must first enable both the App Graph Toggle and the App Graph Recording buttons from the settings.
Steps:
- Go to discovery.
- In the overview page click on the three dot button
- In the context menu select the settings
- The settings dialogue open
Once enabled, users can navigate to the Discovery tab to access App Graph's features.
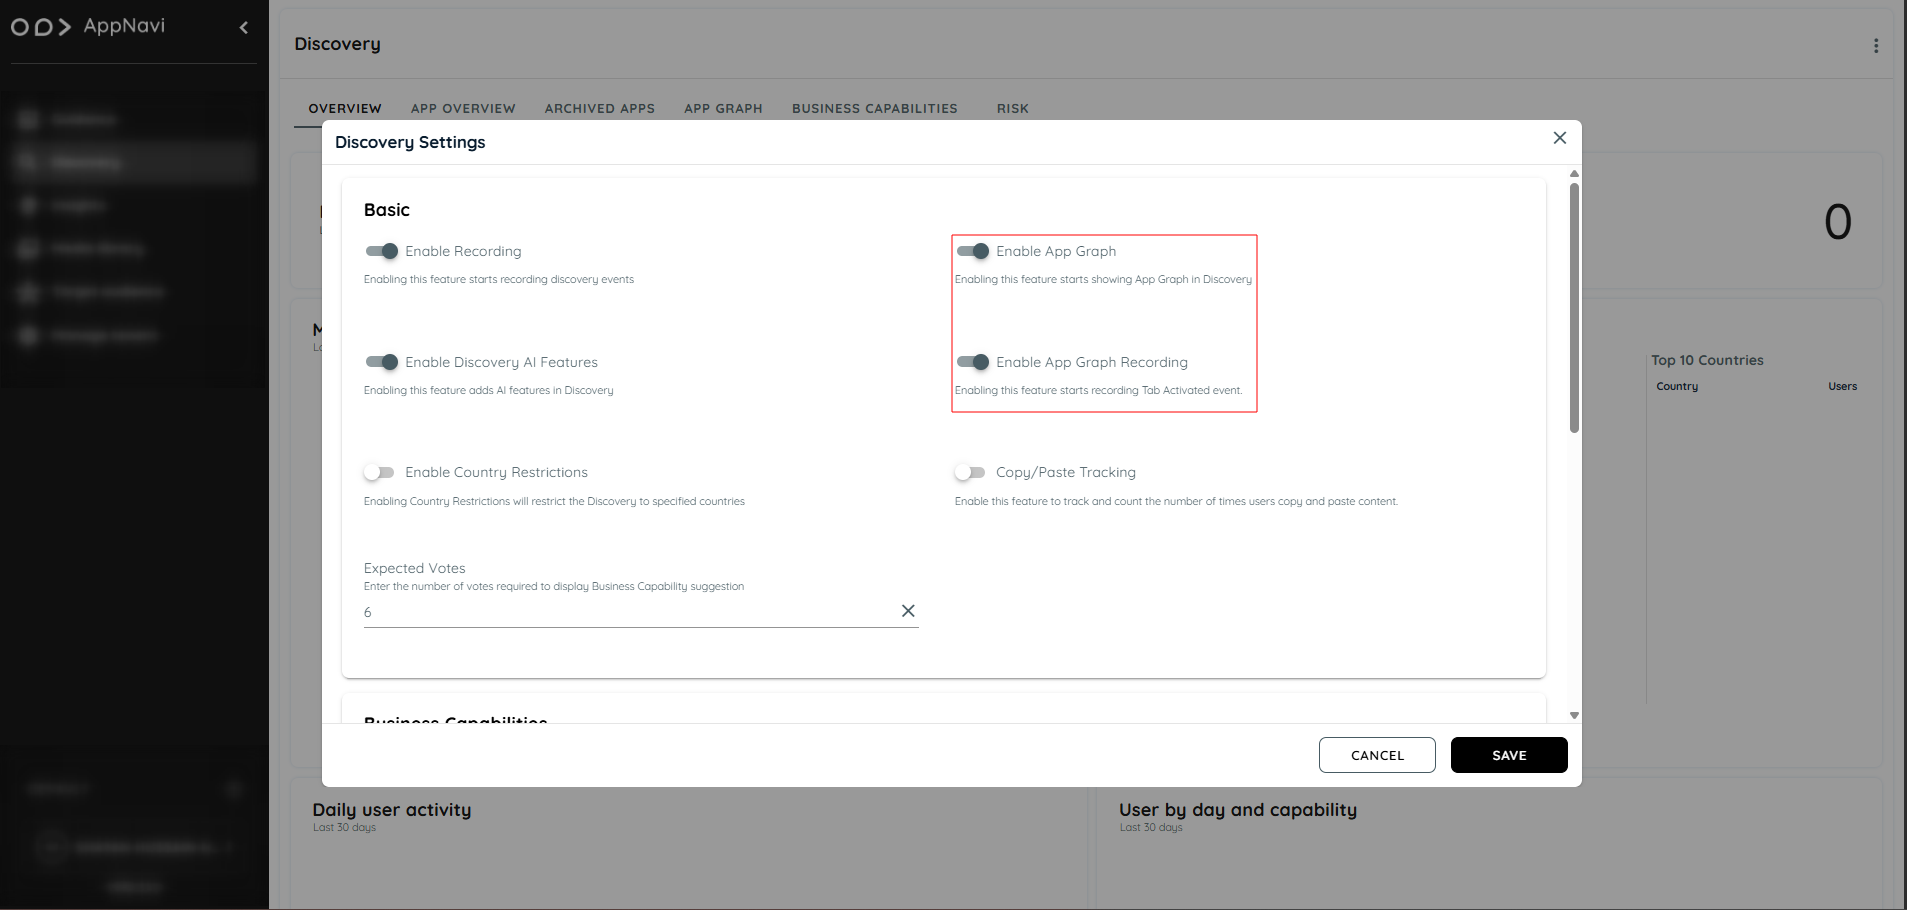
Enabling these options ensures that App Graph accurately tracks and records data on website switches, providing insights into user navigation across multiple platforms
Side Panel Features:
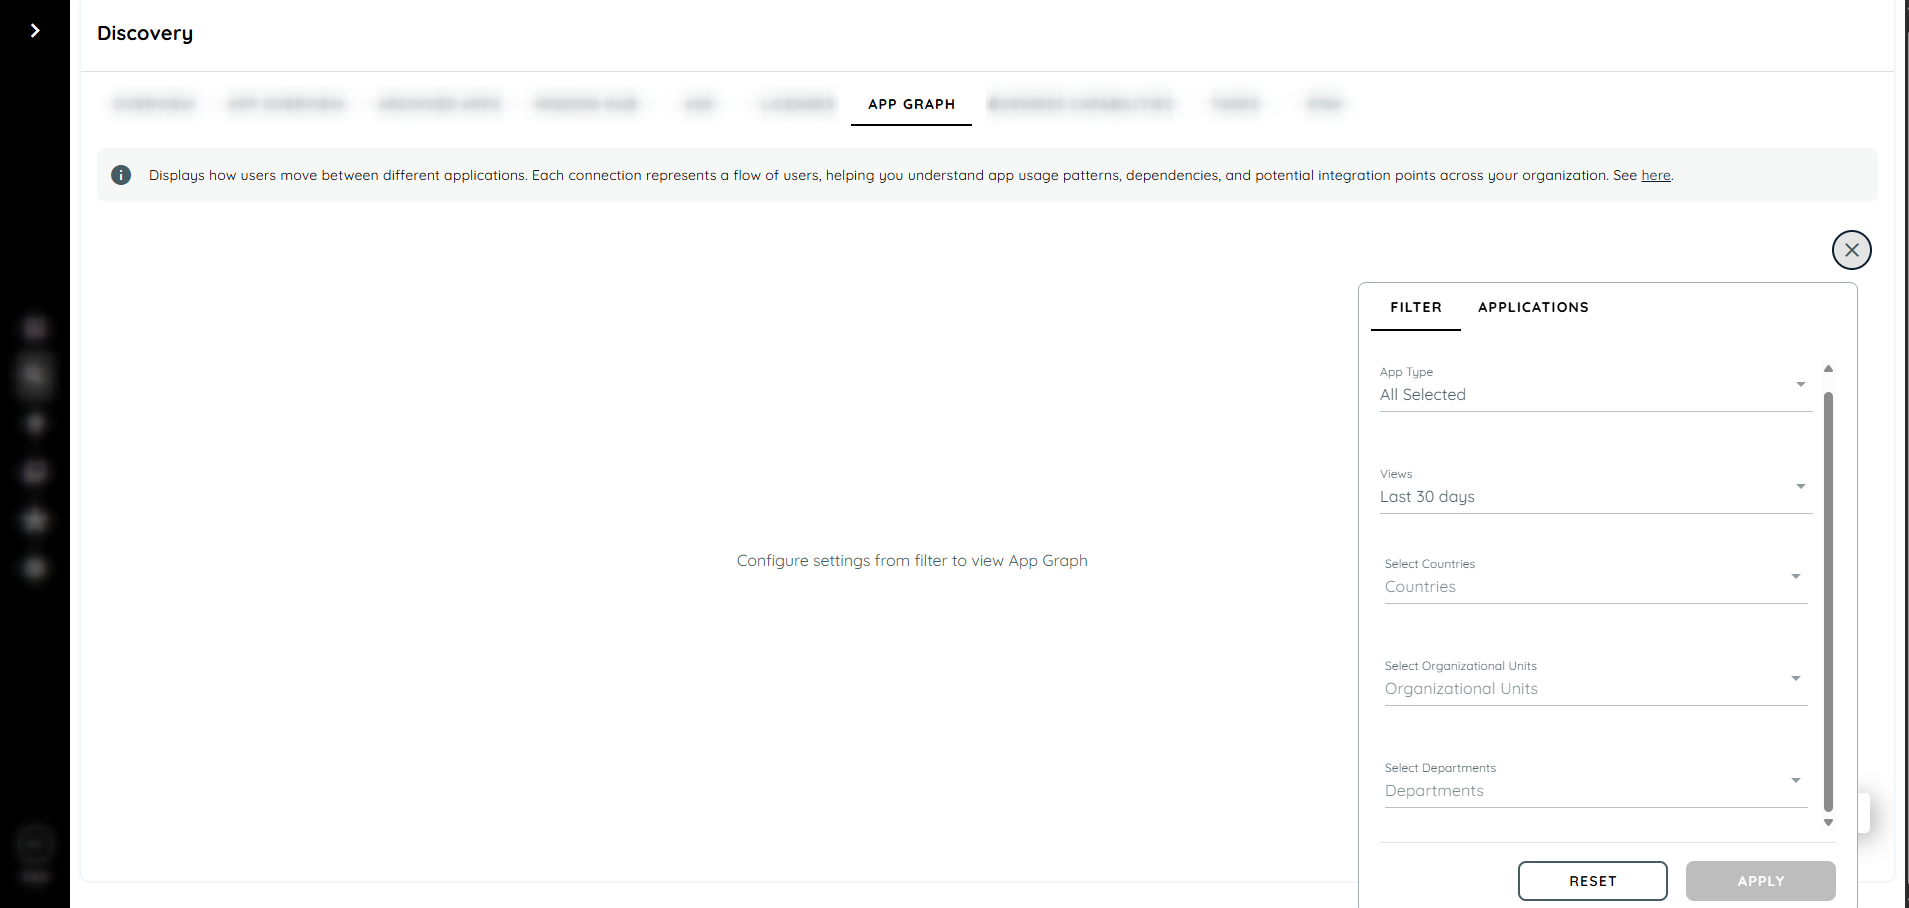
App Graph includes a side panel with two main options:
Filter: Users can customize data by applying filters.
Application: Displays a list of available applications for graph generation.
Filter Options:
App Type:
- All Selected – all applications.
- Company Apps – applications belonging to the company.
- Non Company Apps – external applications.
View (Time Range):
- Last 30 Days
- Last 90 Days
- Custom Date Range
Countries: Displays available countries based on data availability. Users can select a country to filter the graph for that specific location.
Organizational Unit: Filter activity by specific organizational units.
Departments: Filter activity by specific departments.
Filter
Application Options:
The top application is displayed by default, but users can select others from the list to view their graph.
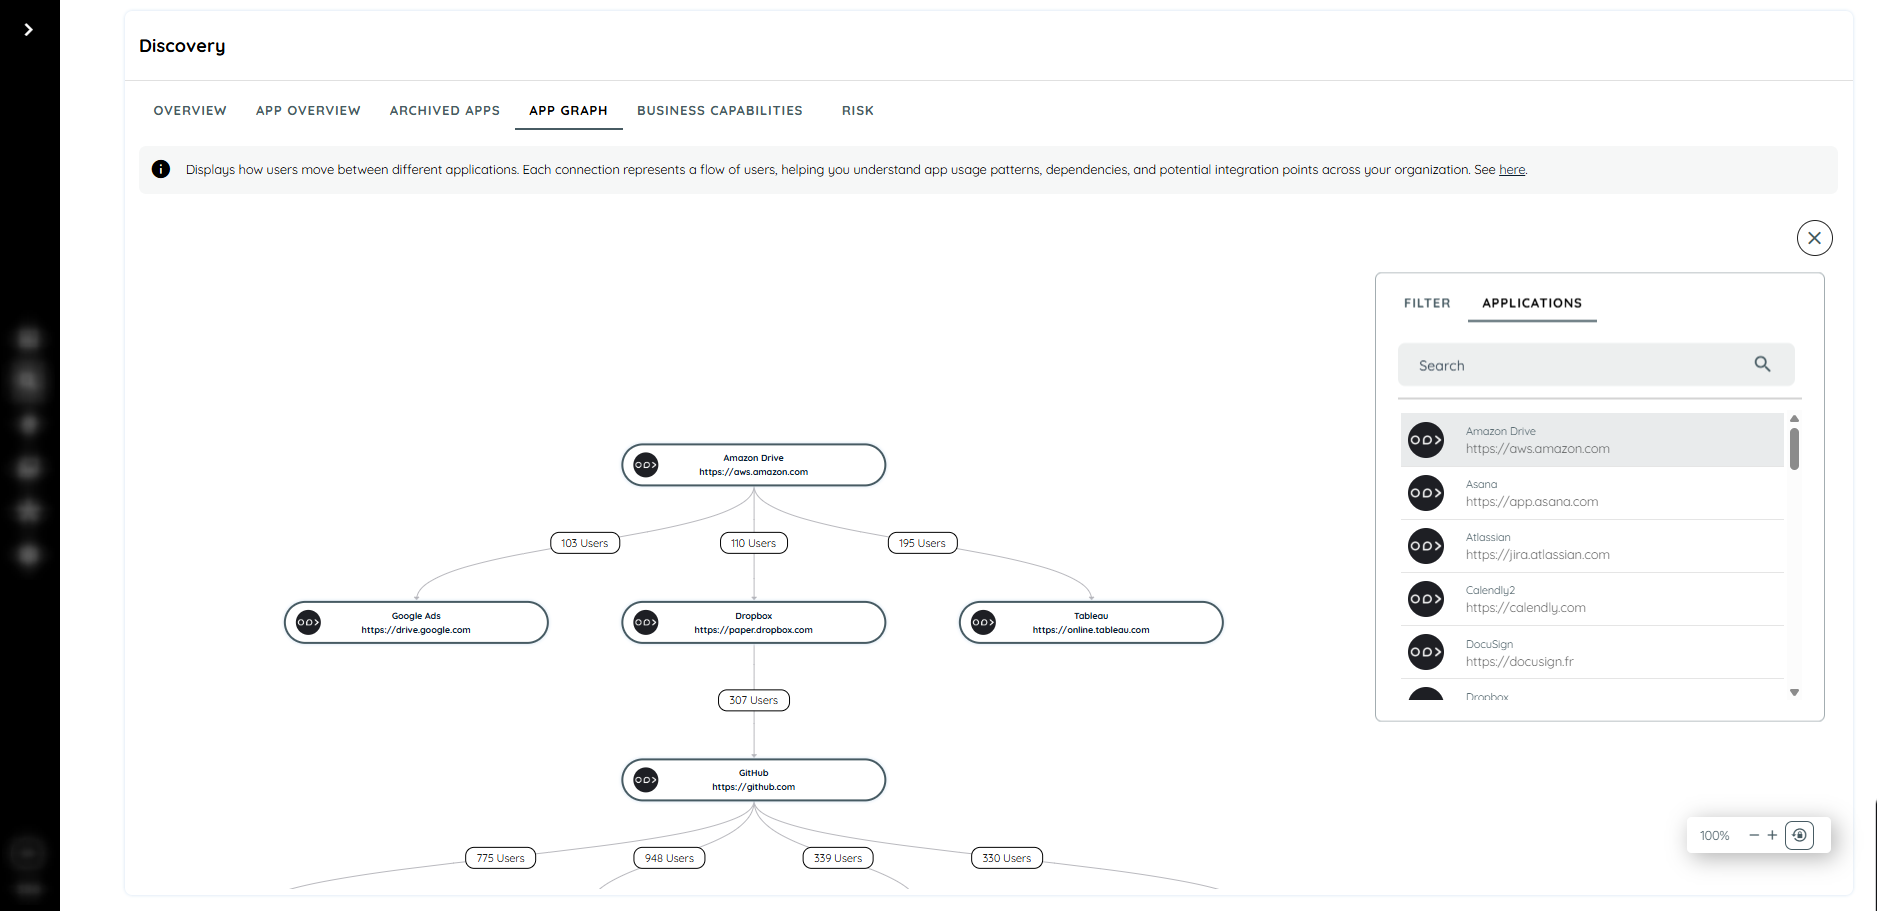
Application Listing
Steps to Access App Graph:
- Navigate to the Discovery tab.
- Go to the App Graph section under Discovery.
Example
Scenario filters Applied:
- App Type: Company Apps
- Country: Germany
- Department: Finance
- View: Last 30 Days
Result:
- Graph displays only company applications used by the Finance department in Germany.
- Tab switch paths and navigation patterns update according to the selected filters.
- Selecting another application redraws the graph while maintaining the same filters.
- This ensures precise and context-specific insights into user behavior across applications.
Updated 5 months ago