App Discovery

The App Discovery feature is designed to help locate all web-based applications that are frequently used by users in an organisation, but its AppNavi application has not been created at the tenant level. Once the App Discovery application is discovered, the user can create an AppNavi application for it.

Enable App Discovery
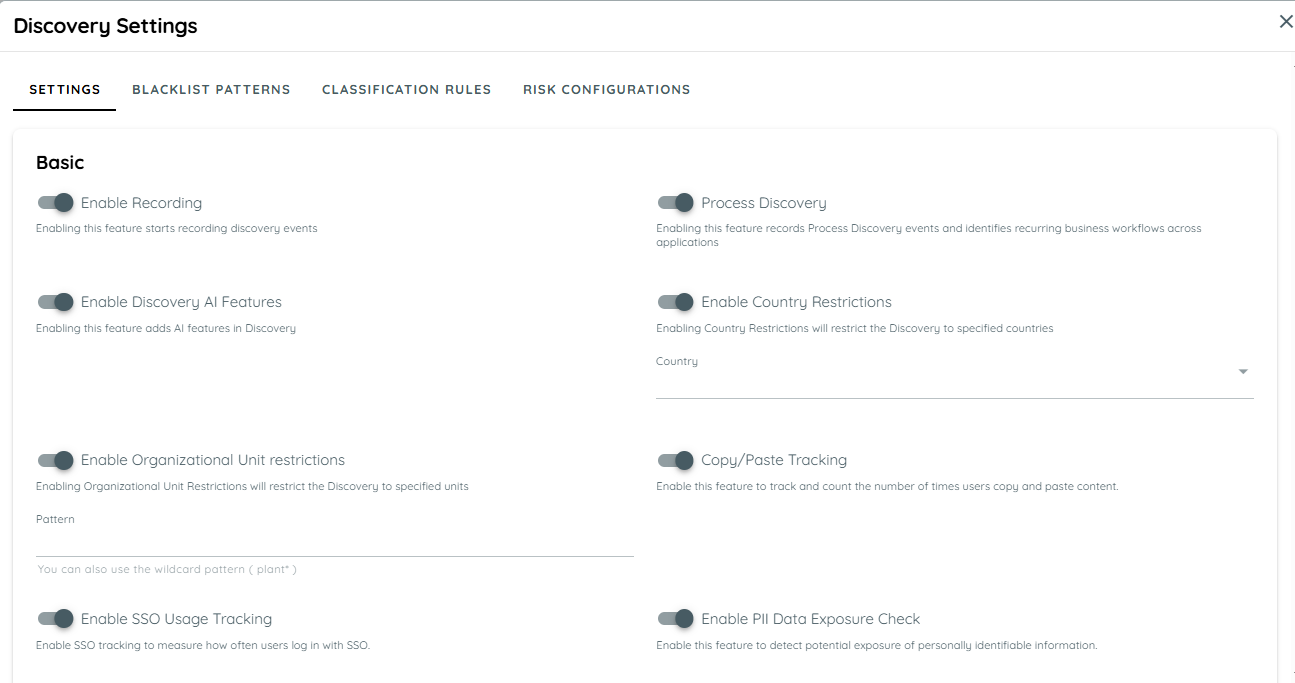
In order to run app discovery, the user has to enable app discovery from "Manage tenant" > Discovery Settings" section. On enabling the app discovery recording, all the options will be available in the discovery settings.

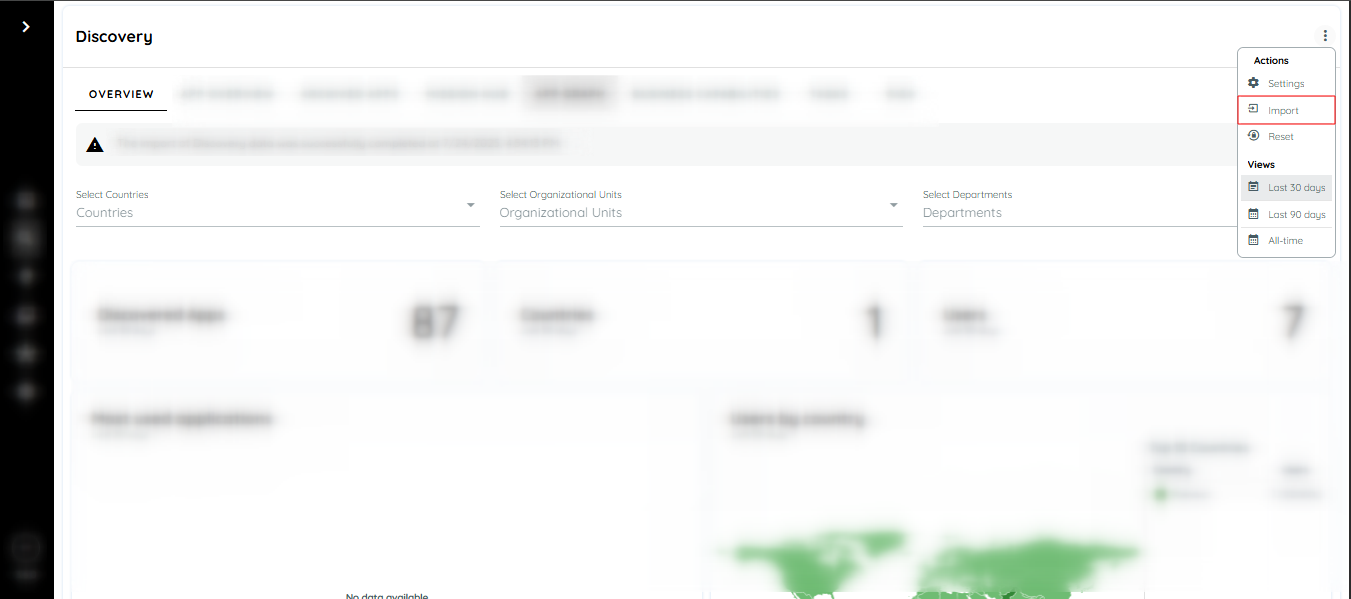
The discovery settings will be available in the discovery tab in the context menu on the top right.


###Import Discovery Data

The import discovery data button helps user to load demo data for Discovery on any newly created tenant so that users can test and demonstrate the functionality of discovered apps with sample generated events. Using this feature the users can visualize the overview dashboard of the discovered apps, app overview including discovered apps, shadow apps and company apps. Users can also archive any application to check its usage and also assign risks including security, compliance and legal. Using the demo data for discovered apps users can also view the business capabilities assigned to the applications which tend to be in the discovered apps list. If there is already some data in the tenant then this button will request new demo data and delete the old data.

For more Import details check Import details

App Discovery Blacklist Patterns

Users have the ability to blacklist specific patterns or URLs, which prevents any applications matching these patterns or URLs from being discovered in the future on client side and applications are also removed from discovery analytics.

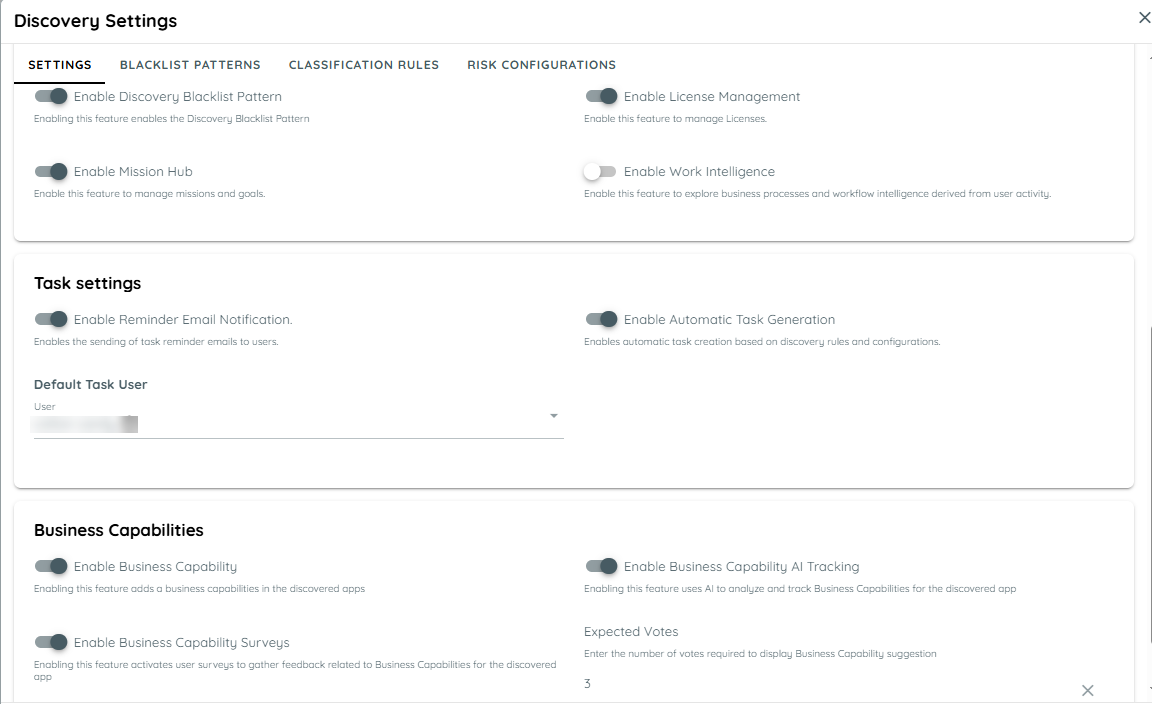
For this, go to Discovery tab and then click on the context menu and open the "Settings" and enable "Discovery blacklist pattern".

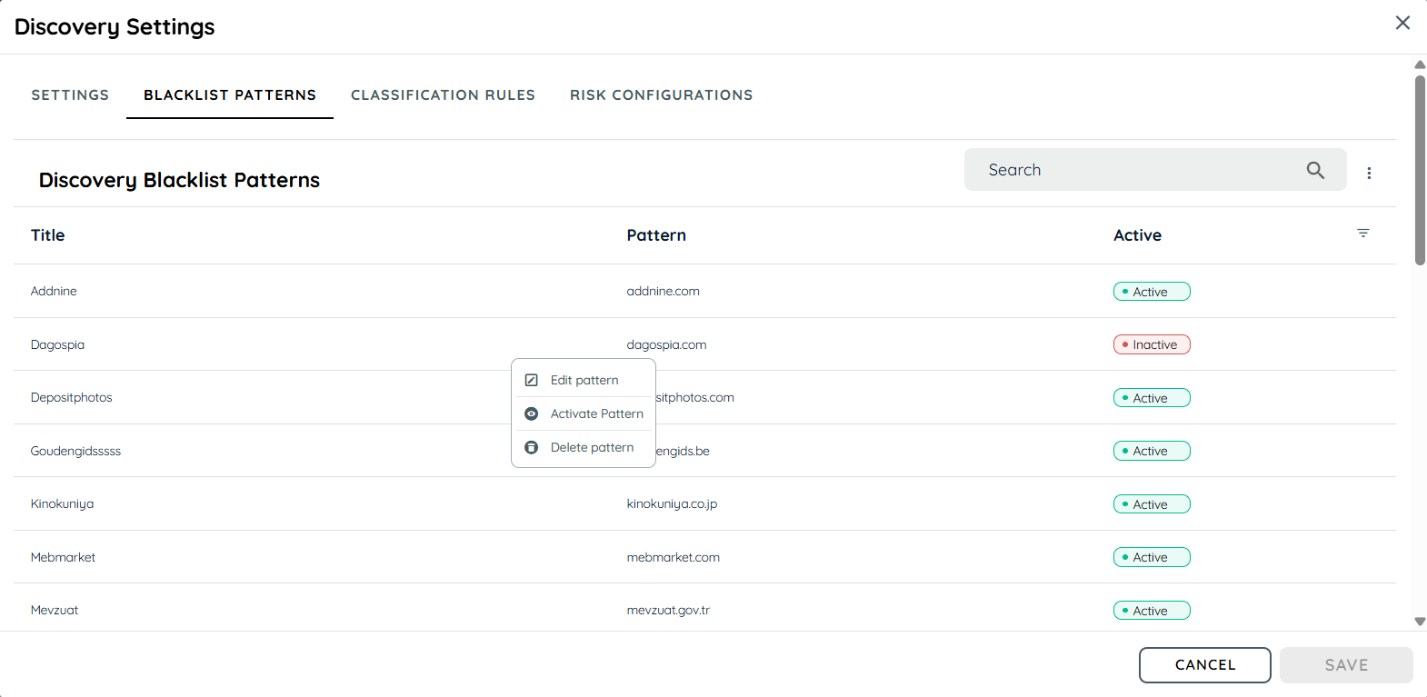
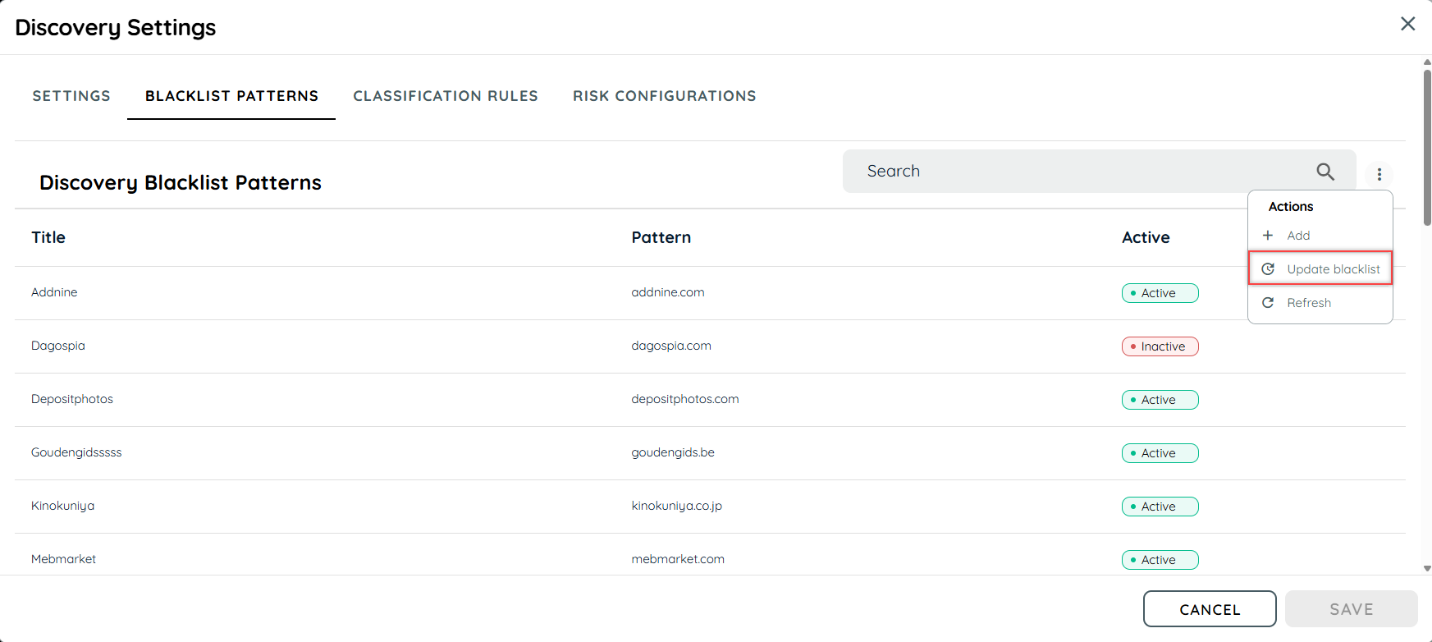
Once the Discovery Blacklist Pattern button is enabled, the App Discovery Blacklist Patterns table will appear. Here user can perform the following functions:

  1. Add Pattern: Click the 3 dots, click context menu and click +Add, a dialect will open where user fills the title, pattern and active status.
  2. Edit Pattern: Here user can edit the above details if require any changes.
  3. Deactivate Pattern: User can deactivate the pattern, once deactivate discovery application will perform normally and will not be the part of blacklist mechanism.
  4. Delete Pattern: User can delete pattern from the table

Update Blacklist
There is Update Blacklist option in context menu, this will update a complete JSON file of blacklist pattern in the table.


How Does App Discovery Work

App Discovery aims to provide insights into user engagement and interaction with each web application. It tracks activity time, which includes scrolling, page interactions, and user engagement. It does not record any user inputs, it just checks for user interaction with the page and record its time. When a user first goes to any web application and App Discovery is enabled and the app is not blacklisted, the extension generates a data for that application if it has not any in the local storage. The data contains information related to App Discovery event like the activity time, userId and appUrl. This data will be used in the App Discovery event which will be sent only once in 24 hours. Only the main website would be considered for App Discovery and interaction in iframe won't be considered for activity time.

Events will include the following information collected by the extension:

Property

Description

browser

Refers to the browser on which the application is discovered (Chrome, Edge)

browserLanguage

Refers to the browser language (en-US, de)

countryCode

Refers to the country from which the event has been recorded based on time zone

integrationMode

Type of integration mode ( “extension“ by default )

pageUrl

Application URL on which the the event was generated, or you can say the discovered app.

https://www.google.de

https://www.google.de/search

https://www.google.de/search?query=23123123

Note only the base URL or origin will be captured. in this case ( https://www.google.de ). All of these are one and the same app.

userId

Refers to the global user id. If there is none, the extension will create one and send it

sessionId

Refers to the session of the user based on tabs

unixTimestamp

Refers to when the event was generated

activityTime

Refers to the activity time of the user in a discovered app

App Discovery Functionalities

To access Discovered App Analytics and its functionalities, please navigate to "Discovery" from the portal.

Following is the functionality of App Discovery.

Discovered Apps
This tile shows the number of Discovered Apps by users over Last 30 days, Last 90 days and All-time. A single discovered app contains 10 unique user data set.

Countries
This tile shows the number of Countries by Last 30 days, Last 90 days and All-time that have 10 or more unique user data set.

Users
This tile shows the count of total users who have visited in the Last 30 days, Last 90 days and All time.

Discovered Apps, Countries, & Users

Discovered Apps, Countries, & Users

Filters & Analytics

Filters available: Country, Organizational Unit (OU), Departments.

Selected filters automatically apply to the Discovery Overview and app overview.

Table & Analytics Behavior

  • Only applications with users matching the selected filters are displayed.
  • All related analytics (Activity Time, Copy/Paste Count, User metrics, etc.) update dynamically based on the applied filters.
  • Users can temporarily adjust filters locally in Discovery Overview for deeper analysis without changing the dashboard selection.

Example

  • Filters: Country = Germany, OU = IT, Department = Development

Discovery Overview table and analytics will reflect only applications and metrics corresponding to this subset of users.

Users by Departments

The Users by Departments section displays the distribution of users across different departments over the last 30, 90 and All days. The data is available in both Chart and Table views for better analysis and accessibility. In the chart view, each bubble represents a department. When hovering over a department bubble, showing the total user count and the percentage contribution of that department. Users can switch between Chart and Table views based on their preference.

Users by Organizational Unit

The Users by Organizational Unit section provides a visual overview of user distribution across different organizational units for the last 30, 90 and All days. Users can switch between Chart and Table views based on their preference. Each bubble in the chart represents an organizational unit. When hovering over a organizational bubble it's reflecting the number of associated user and percentage share of that organizational unit.


Most Used Applications

This Bar chart displays the top 5 and bottom 5 applications based on the number of users, showcasing the applications with the highest user count.
It will show data for the Last 30 days, last 90 days and All-time.

Most Used Applications

Most Used Applications

Analytics of Most Used Applications

To access Detail App Analytics and its functionalities, users can click on an application from the most used application chart or from the Analytics option present in the context menu of the discovered application tab.
The top title will show the URL of the selected application.

The analytics data on this page will not be fetched through nightly jobs, as this time push load of 1000s of application in nightly job. Instead user can fetch data on a particular app through the refresh Icon present on each application analytics page. This will fetch the analytics data of a specific app at a time.

Following is the information:

Filters
Filters drop downs for countries, organizational unit and departments have been added and users can filter out data with applying a combination of all three filters or may use them separately.

Views:
A new view option has been added to the Discovered Apps Analytics page, providing four options: Last 30 Days (default), Last 90 Days and All-time. Users can access these options through the context menu in the top right corner. Once a filter is selected, the data across all charts will automatically update to reflect the chosen time period.

Users
This shows the count of users in the past 30 days, last 90 days and All-time that were discovered within the application.

Avg. Activity Time
The activity time is calculated from the records for the selected time range, where we sum the total activity time and then divide by the total users to calculate the average. The time durations are displayed in minute’s format, for example, "3:20," indicating 3 minutes and 20 seconds.

Countries
The count of countries from which users have come in the last 30 days, Last 90 days and All- time for that specific application.

Users Chart
The line chart displays the number of users who have arrived on each date.
It will show data for the Last 30 days, Last 90 days and All-time.

Users by Countries
A country chart that displays the origin or source countries of the users from where they have visited.
It will show data for the Last 30 days, Last 90 days and All-time.

Division by Language
A pie chart depicting the distribution of languages based on the number of users.
It will show data for the Last 30 days Last 90 days and All-time.

Division by Browser
A pie chart depicting the distribution of browsers based on the number of users.
It will show data for the Last 30 days Last 90 days and All-time.

Application Usage
The line chart displays the usage of the application on each date.

Distribution by organization unit
A pie chart depicting the distribution of organizational units used by the users.

Detailed Analytics of Most Used Applications

Detailed Analytics of Most Used Applications

Users by Country

An insightful country chart illustrating the source countries of users and their corresponding visitation frequency. The chart highlights countries with 10 or more distinct users. It will show data for the Last 30 days, Last 90 days and All-time.

Users by Country

Users by Country


Analytics of Users By Country

If the user clicks on any country, a new analytics page will open for that specific country. Following are the chart details that are mentioned in this analytics:
Applications: Total number of applications that belong to a specific country.
Users: Total number of users that belong to a specific country.
Activity Time: Average activity time users spend in that country.
User Chart: It tells the total number of users date-wise.
Capabilities Show all the capabilities that are accessed by this specific country. It further shows the total number of users.
Discovery App Table: This table shows data of Application, Title, Capabilities, User, and Activity Time.


Detailed Country Analytics

Detailed Country Analytics

Daily User Activity

The chart depicts the average time users allocate to each capability. The average duration is computed based on a fixed 9-hour workday. This implies that dedicating 9 hours during their work hours would represent complete utilization, equivalent to 100% of the allocated time. It will show data for the Last 30 days, Last 90 days and All-time.

Daily User Activity

Daily User Activity


Users by day and capability

The chart depicts the percentage of users used each capability on a daily basis, it also show the avg time for each capability.
It will show data for the Last 30 days, last 90 days and All-time.

Users by Day and Capability

Users by Day and Capability


Capabilities by Users

An insightful country chart illustrating the source capabilities of users and their corresponding visitation frequency. The chart highlights countries with 10 or more distinct users.
It will show data for the Last 30 days, Last 90 days and All-time.

Capabilities By User

Capabilities By User


Analytics of Capabilities by Users

If the user clicks on any capability, a new analytics page will open for that specific capability. Following are the chart details that are mentioned in this analytics:
Applications: Total number of applications that belong to a specific capability.
Users: Total number of users that belong to a specific capability.
Activity Time: Average activity time users spend in that capability.
User Chart: It tells the total number of users date-wise.
User by Country Show all the countries that are accessed by this specific capability. It further shows the total number of users.
Discovery App Table: This table shows data of Application, Title, User, and Activity Time.

Detailed Analytics of Capabilities

Detailed Analytics of Capabilities


Browser

This is a pie chart that shows the distribution of browsers based on the number of users. Browsers that have 10 or more users will be displayed in the chart. It will show data for the Last 30 days, Last 90 days and All-time.


Discovered Apps

This is a table that lists all the discovered apps that have 10 or more users. This table encompasses comprehensive data related to a discovered app, including its title, capability, type, user, activity time, and intensity score. Additionally, users can filter data that they wish to display in the table. The table contains the following columns:

check more details on Apps Overview

Edit App
This option will open an edit dialog from which users can add a title, application URL, hosting, vendor, category, privacy policy, terms of service and assign an AppNavi application in the Basic settings.

Users can also assign capabilities to the discovered apps in the Business Capability tab.

User can select all options for security, compliance and legal in the Risk tab.

User can assign tasks related to any discovered app.


SaaS Applications

When an application is discovered by the global SaaS from the backend, it will include all details present in the Global SaaS catalog application.

During editing, it will display all details from the global SaaS application.

If a user edits any details, the changes will be saved with the user's details and will not be altered during rediscovery of the application.

However, if the application is deleted and then rediscovered, it will display all original details and will not consider the user's modifications.

Copy/Paste Tracking

The system is designed to record the number of copy/paste events. Users can enable or disable this feature through the discovery settings within the tenant. To facilitate this, new columns for Copy/Paste events will be added to the discovered apps table. These recorded values will also be included in Export.

A tenant Owner can enable the copy paste events from the discovery settings and then a copy/paste count will be recorded for an application

The Tenant Owner must first enable the Discovery option. Once Discovery is enabled, the Tenant Owner can then select the Recording option. If both Discovery and Recording are enabled, the Tenant Owner can activate the Copy/Paste toggle to start recording copy/paste events.

Once copy paste is enabled from here, it will record it for all apps being discovered.

SSO Usage Tracking

SSO Usage Tracking is a Discovery feature that shows how much each discovered application uses Single Sign-On (SSO) for login. It detects which identity providers (IdPs) are used and records login events for analysis.

This feature helps organizations see SSO adoption clearly, without changing any existing event data or login flows.

Why This Feature Is Used

Understanding SSO adoption is vital for security and compliance teams. It allows organizations to:

  1. Know SSO adoption: See which applications are using secure login with SSO.
  2. Identify providers: Find out which IdPs are being used most.
  3. Monitor security: Make sure logins happen through trusted identity systems.
  4. Plan improvements: Understand usage trends to improve SSO adoption.

This feature provides a simple and standardized approach to track authentication methods at scale, helping organizations move toward centralized identity management.

How It Works in AppNavi

When SSO Usage Tracking is enabled, the Discovery feature evaluates event patterns that match valid authentication flows. Only complete flows where a user session transitions from an application to an identity provider and then back to the same application are considered valid.

  • Discovery checks login events on already discovered applications.
  • If a user logs in using SSO, the system records the event.
  • Discovery identifies the IdP and client ID for that login.
  • The system counts SSO events and calculates the SSO Usage Index:

This ratio is normalized into an SSO Usage Index and displayed in the Discovery table and dashboards. The following logic is used for normalization:

Priority levelMeaning
LowMinimal use of SSO
MediumPartial use of SSO
HighStrong SSO adoption

Purpose of This Feature

The goal is to give clear insight into which discovered apps use SSO and how often. This helps with:

  • Security checks: Make sure users log in via trusted IdPs.
  • Usage reports: See trends and adoption rates.
  • Better planning: Decide where to encourage SSO adoption.

No passwords or sensitive data are saved. Only SSO login events and provider information are recorded.

How to Configure

  1. Navigate to the Discovery Overview page within the portal.
  2. Click on the three-dot (⋮) menu to open the settings panel.
  3. Enable the SSO Usage Tracking toggle.
  4. Save the changes.

Once enabled, Discovery begins analyzing authentication flows for detected applications. When users access applications using SSO, corresponding events are captured automatically.

Supported Identity Providers

The feature currently supports the following identity providers:

  • Google
  • GitHub
  • GitLab
  • Microsoft
  • Auth0
  • Azure B2C
  • Okta
  • Amazon Cognito
  • Keycloak
  • Ping Identity

The architecture allows new providers to be added easily through future updates.

Example Scenario: Tracking SSO Usage in Discovery

An organization enables SSO Usage Tracking to understand authentication adoption across its internal applications.

Steps

  1. Enablement

In the Discovery overview, the administrator activates the SSO Usage Tracking toggle and saves the configuration.

  1. Event Capture
  • A user accesses an application integrated with AppNavi.
  • The user logs in through an identity provider such as Okta or Google.
  • Discovery detects a valid SSO flow (App → IdP → App) and enriches the event with provider name and client ID.
  1. Data Aggregation
  • Over time, Discovery aggregates login data and calculates the ratio of SSO logins to total app logins.
  • The ratio is normalized into an SSO Usage Index (Low, Medium, High).
  1. Visualization
  • Discovery table shows a new SSO Usage column.
  • Hovering over it shows a tooltip, e.g., “72 of 120 user–app–days with SSO (60%) in last 30 days.”
  • Provider breakdown is also shown, e.g., “Entra 70%, Google 30%.”
Hovering on the SSO chip

Hovering on the SSO chip

Clicking on the SSO Usage chip opens a dialog that lists all identity providers used, along with their respective percentages.

SSO information dialog

SSO information dialog


PII Exposure Detection

The PII Exposure Detection feature helps Security and Compliance Administrators identify potential risks related to sensitive information being copied or pasted within monitored applications. The system identifies possible PII elements: email addresses, phone numbers and IBANs during clipboard actions, without ever collecting or transmitting the actual clipboard content.

The feature is privacy preserving and fully configurable through global or per application settings in the Discovery module.

The system only sends numerical counts of detected PII items:

  • Number of email addresses
  • Number of phone numbers
  • Number of IBANs

Configurable Controls

Administrators can enable or disable the feature at two levels:

  1. Global Level (Discovery Settings)
  • Global Toggle: Enable PII Data Exposure (Copy & Paste)
  • Default state: OFF
  1. Application Level
  • Each application inherits the global setting.
  • If the global toggle is ON, admins can enable/disable the feature per app.

Detection only runs when both the Global and App toggles are ON.

How PII Detection Works

  1. Enabling the PII Detector

To activate PII detection, two settings must be enabled:

Global Discovery Setting

The feature must first be turned ON from the main Discovery settings.

Application-Level Setting

After the global toggle is enabled, you must also enable the feature for each specific application.

PII detection will only run when both settings are ON.

By default, the PII detector appear enabled.

  1. Detection Behaviour

Once enabled:

  • The system monitors copy (outflow) and paste (inflow) actions performed within the discovered application.
  • If a user copies or pastes any of the following:
    • Email address
    • Phone number
    • IBAN

The detector will identify the presence of these PII elements.

  1. Counting & Displaying Results
  • Each time a user copies or pastes PII, the corresponding PII count increases.
  • These counts are then processed in the backend to calculate the application’s PII exposure level.
  • The result is displayed to users in the Discovery module on the Discovered Apps table as two columns
    PII Inflow Risk and PII Outflow Risk (High, Medium, Low) , based on the total detected PII activity.

User can click over the badge to view total detected PII counts within selected date range

How Risk is Measured

The backend aggregates detection counts to determine the exposure level for each application.

  1. Raw Weighted Score

Each PII type contributes differently to the overall risk:

PII TypeWeight
Email1
Phone2
IBAN5

RAW Score = (Emails × 1) + (Phones × 2) + (IBANs × 5)

  1. Density per 100 Actions

Risk is normalized based on total clipboard activity:

R100 = (100 × RAW) / Total Actions

  1. Normalized Score (0–100)

The platform converts density into a normalized risk score based on a reference level (default: 50):

Score = normalization of R100 into a 0–100 scale

  1. Risk Levels Displayed in the Apps Table
Normalized ScoreLevel
≥ 50High
20–49Medium
< 20Low

Note : User can click over the badge to view total detected PII counts within selected date range.

PII Exposure Trend – App Dashboard

Overview

The PII Exposure Trend feature helps Security and Compliance Administrators track the evolution of potential sensitive data exposure over time for each application. It provides a visual summary of inflow (paste) and outflow (copy) risks based on PII detection scores, helping you identify patterns and trends in data handling.

Key Features

  1. PII Exposure Trend Section
  • Each application Analytics dashboard includes a dedicated section labelled "PII Data Flow".
  • The section is only visible if PII detection is enabled globally and for the specific application.
  1. Line Chart Visualization
  • The trend is displayed as a line chart showing normalized PII exposure scores over time.
  • X-axis: Time (based on the selected dashboard range)
  • Y-axis: Normalized Score (0–100)
  • Lines:
    • Inflow Score (paste actions)
    • Outflow Score (copy actions)
  1. Interactive Tooltips
  • Hovering over the chart shows detailed information:
    • Exact Inflow and Outflow scores
    • Corresponding timestamp
  1. Behavior
  • The chart adapts to the selected time range on the dashboard.
  • If PII detection is turned off globally or for the app, the chart is hidden.

User Segmentation in Discovery

The Discovery dashboard now includes three new usage segmentation columns to help user understand how frequently users engage with each application:

  • Power Users
  • Regular Users
  • Occasional Users

These columns appear directly in the application overview table and provide at a glance insight into application adoption patterns across your organization.

What These Segments Mean

Users are grouped based on how often they use an application on average per week within the selected time range

SegmentMeaning
Power UsersUsers who engage with the application more than 4 days per week on average.
Regular UsersUsers who engage 2 to 4 days per week on average.
Occasional UsersUsers who engage less than 2 days per week on average.

Only users who accessed the application at least once during the selected time range are counted.

Time Range Dependency

User segmentation automatically adjusts based on the selected reporting time range. You can select different time periods to see how engagement changes over time.

Minimum supported time range: 30 days

How User Frequency Is Calculated

To keep things consistent across different time ranges, Discovery uses the following approach:

  1. Counts how many days a user was active during the selected period.
  2. Divides that number by the number of weeks in that period.
  3. Rounds the result to the nearest whole number.
  4. Assigns the user to one of the three segments based on the rounded value.

Examples

  • 15 active days in a 30-day range → 15 ÷ 4 weeks = 3.75 → 4 → Regular User
  • 22 active days → 22 ÷ 4 = 5.5 → 6 → Power User
  • 3 active days → 3 ÷ 4 = 0.75 → 1 → Occasional User

Business Capability Suggestions

A BC Suggestion (Business Capability Suggestion) is a feature that recommends potential business capabilities for an application based on algorithmic analysis. It provides a list of suggested capabilities, each with an associated probability percentage, indicating how likely it is that the capability applies to the application. Users can review these suggestions and choose to add them to the application’s list of business capabilities.

  • Each BC will only appear once in the BC Suggestions field, which is shown in the edit dialog of the Discovered App.
  • The BC suggestions include a probability percentage, helping users decide which Business capability to add.
  • Users can choose Business capability from the BC Suggestions list.
  • Business capability already added won’t appear in the suggestions list. If a BC is removed from the app, it will show up again in the suggestions, if previously calculated.
  • BC Suggestions will only be visible if this feature is enabled from settings page of discovery listed as "Enable Business Capability Tracking"
Business Capability Suggestions

Business Capability Suggestions

Delete Discovery Data

Users can delete all Discovery Data by following these steps:

  1. Navigate to Discovery tab.
  2. Click on the context menu.
  3. Click the "Reset" button.
  4. A confirmation dialog will appear.
  5. Confirm the action to proceed with deletion.

After confirmation, the system will begin deleting the discovery data. The process may take a few minutes to complete.


Note: This action will permanently remove all existing discovery data and cannot be undone.

Filter for Discovery Recording

Discovery recording/event can be controlled with respect to location and organization unit by apply different type of filter on it, means user can customize setting in a way that recording may happen only in certain countries or certain organization unit.

These settings can be found in "Discovery Setting".

Steps:

  1. Navigate to the discovery
  2. Click on the three dots button
  3. The settings dialog will appear

Types of Filters

There are two types of filtration/restriction that can be done to control recording of the discovery events.

  1. Country Restriction: If enabled, user will select countries from the list where he want recording to happen. Events will be recorded only in those areas that are selected by the users. If this filter is disabled than events will be recorded in all the countries.
  2. Organizational Unit Restriction: : If enabled, user will add patterns along with wildcards like: TestFilter* , this pattern will allow all kind of extension that are added in this pattern for example: TestFilter1, TestFilter12, TestFilter56fh. Events will be recorded only with the mentioned pattern list that are added by the users. If this filter is disabled than events will be recorded without any restricted pattern.
    User has to set the same organization unit pattern in the system registry in order to record the discovered event. For further assistance please check the following mentioned document: Organizational Unit