Reports
The Reports tab in Insights Analytics provides a powerful, real-time reporting tool that allows exploration of user activity data through a dynamic and user-friendly interface. The interface supports advanced filtering, grouping, and column-level management for clear and efficient data analysis.
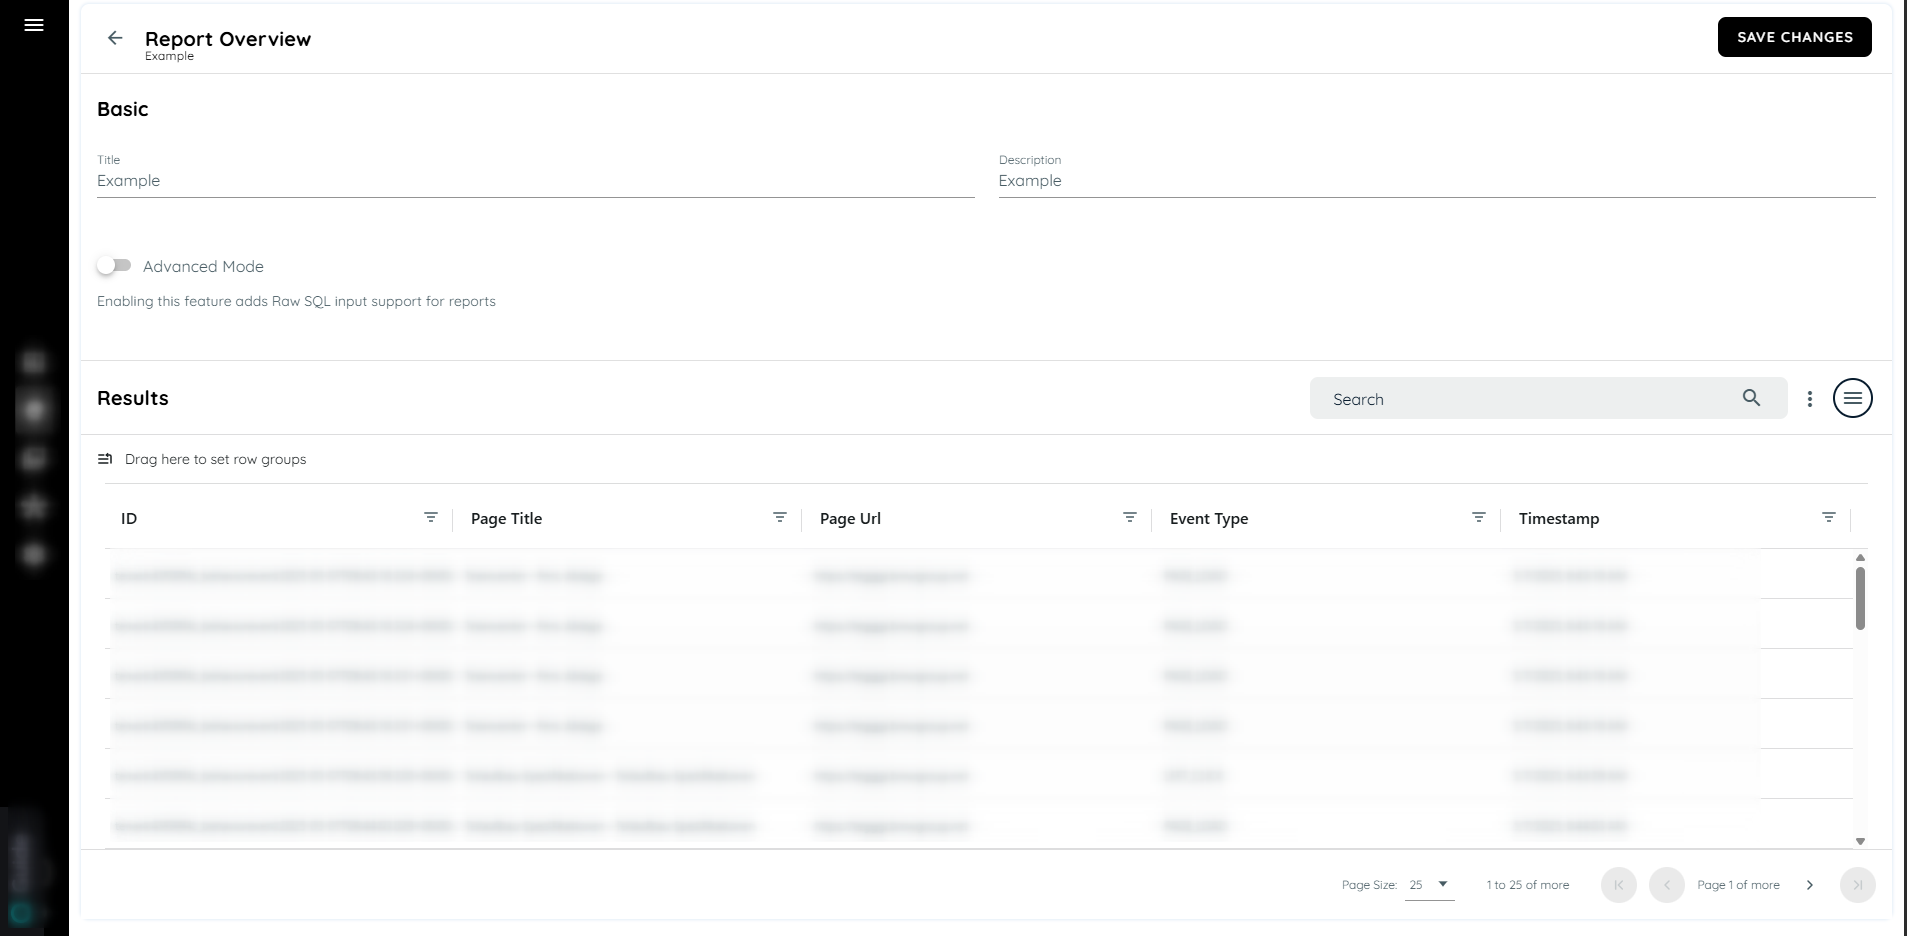
Reports
The Reports Feature provides real-time querying so that you can see the latest data whenever you run a report. Unlike other reporting tools, this feature ensures your data is always fresh and up-to-date.
Key Features
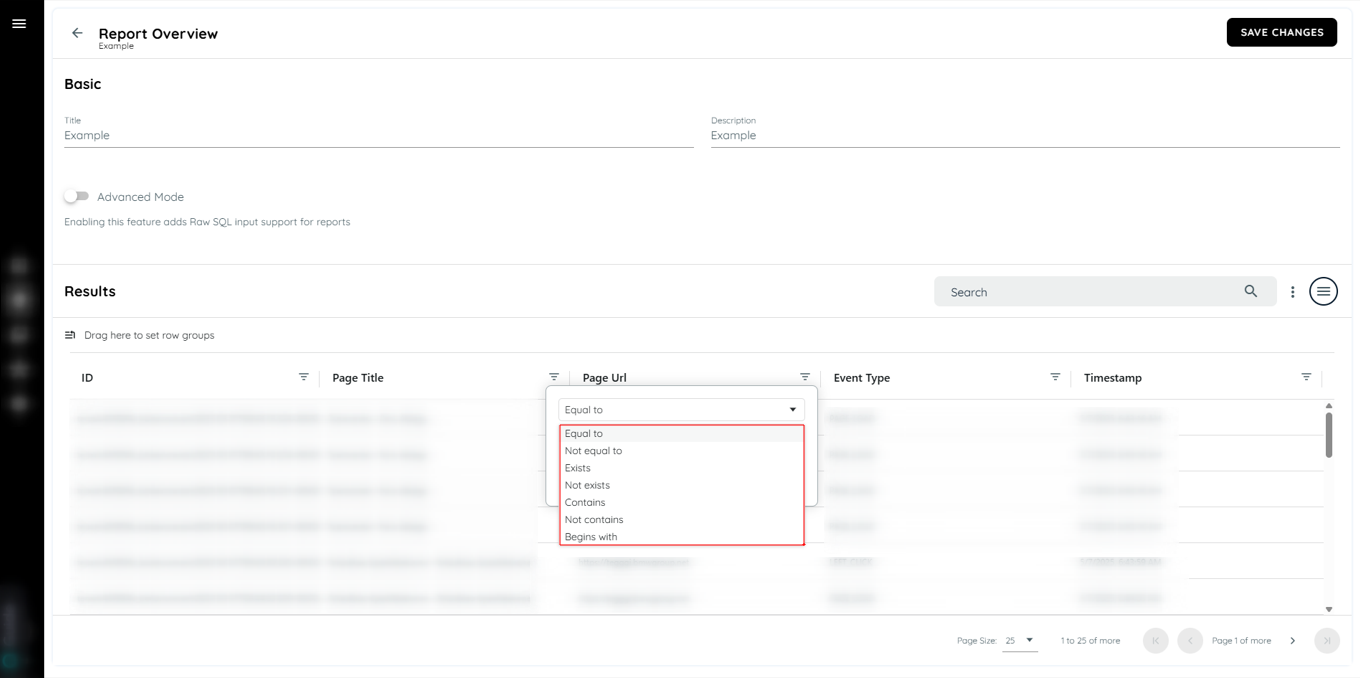
Column Filtering
Each column in the reports table supports filters using the following operators:
- Equal To
- Not Equal To
- Exists
- Not Exists
- Contains
- Not Contain
- Begins With
For timestamp fields, a date filter is available to refine the data by date range.
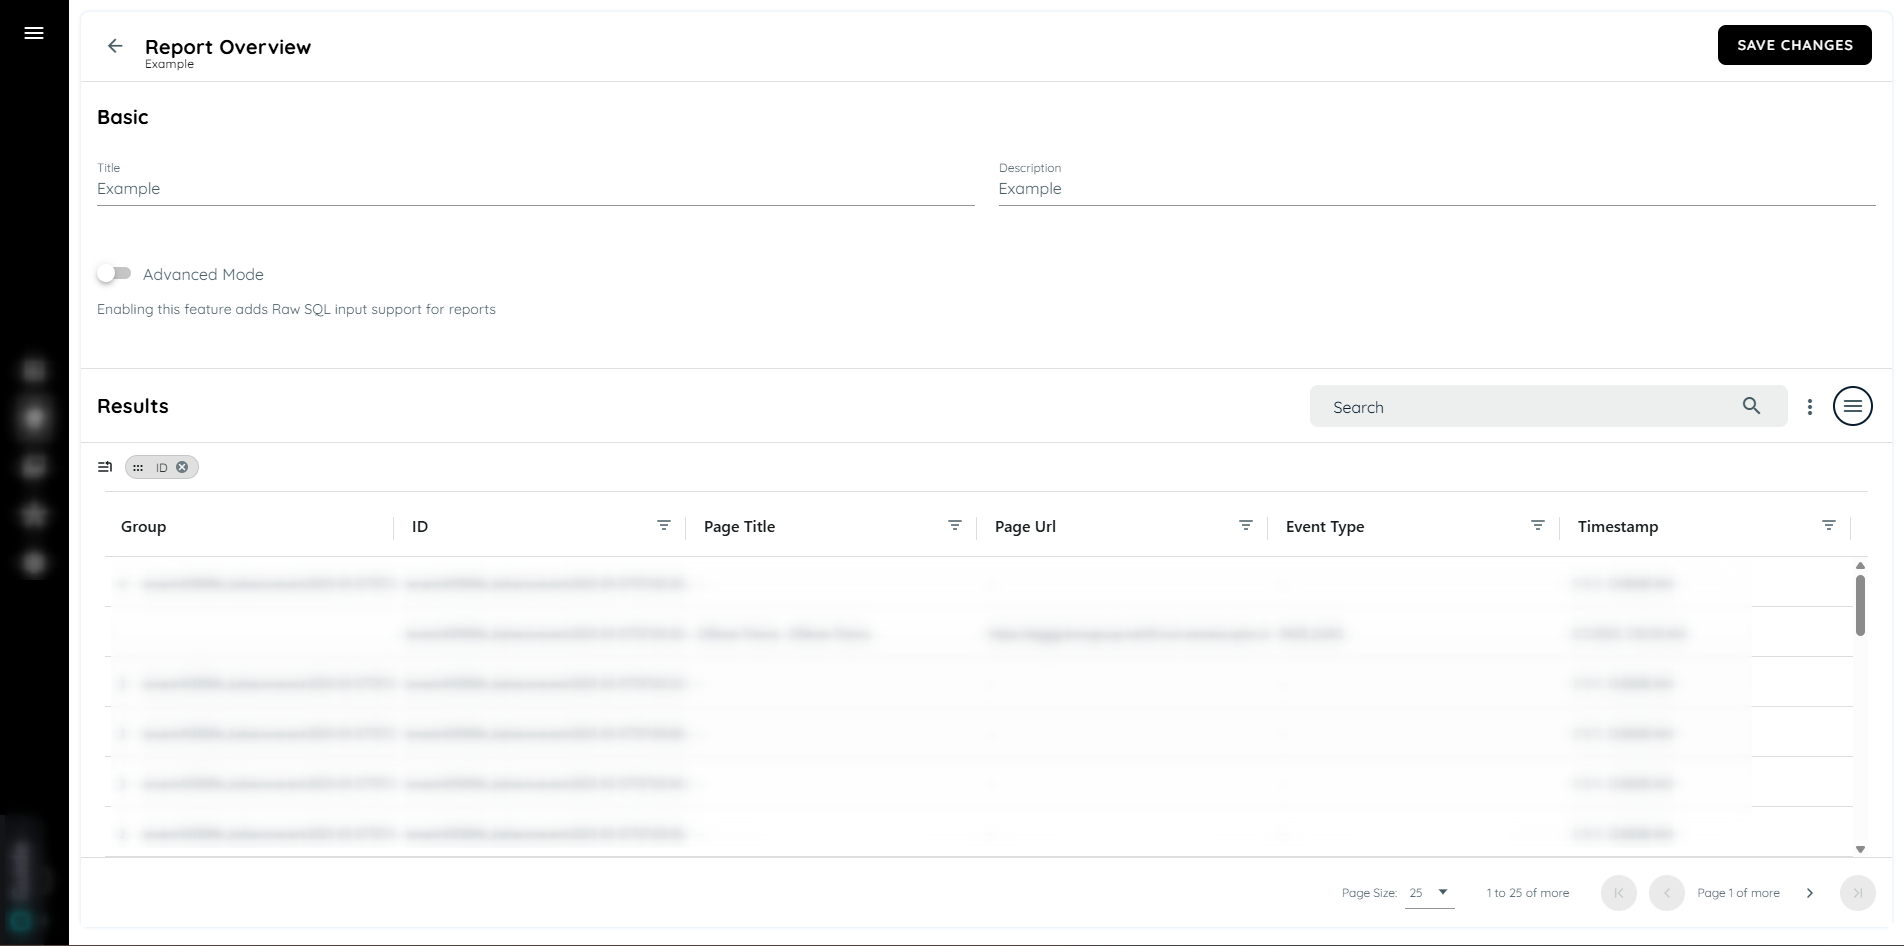
Grouping and Column Behavior
- All the Columns such as e.g. ID can be dragged to the top header to apply grouping.
- Remove the Group column from the header will reset the data.
- A maximum of three grouping fields can be used at once.
- Grouped columns are retained in Excel exports.
- Dragging a column outside the grid removes it from view. Refreshing the page restores the original column layout.
Configuration Panel
A left-side configuration panel helps you control what data appears in your report, organized into two tabs:
Structure Tab:
- Select which fields you’d like to display in the report.
- This tab also allows you to set up Flexible Grouping, where you can organize data by up to three fields to view summarized information.
For example, users can group by country, browser, or event type, giving you a structured view of the data. Grouped data is retained in the exported reports as well.
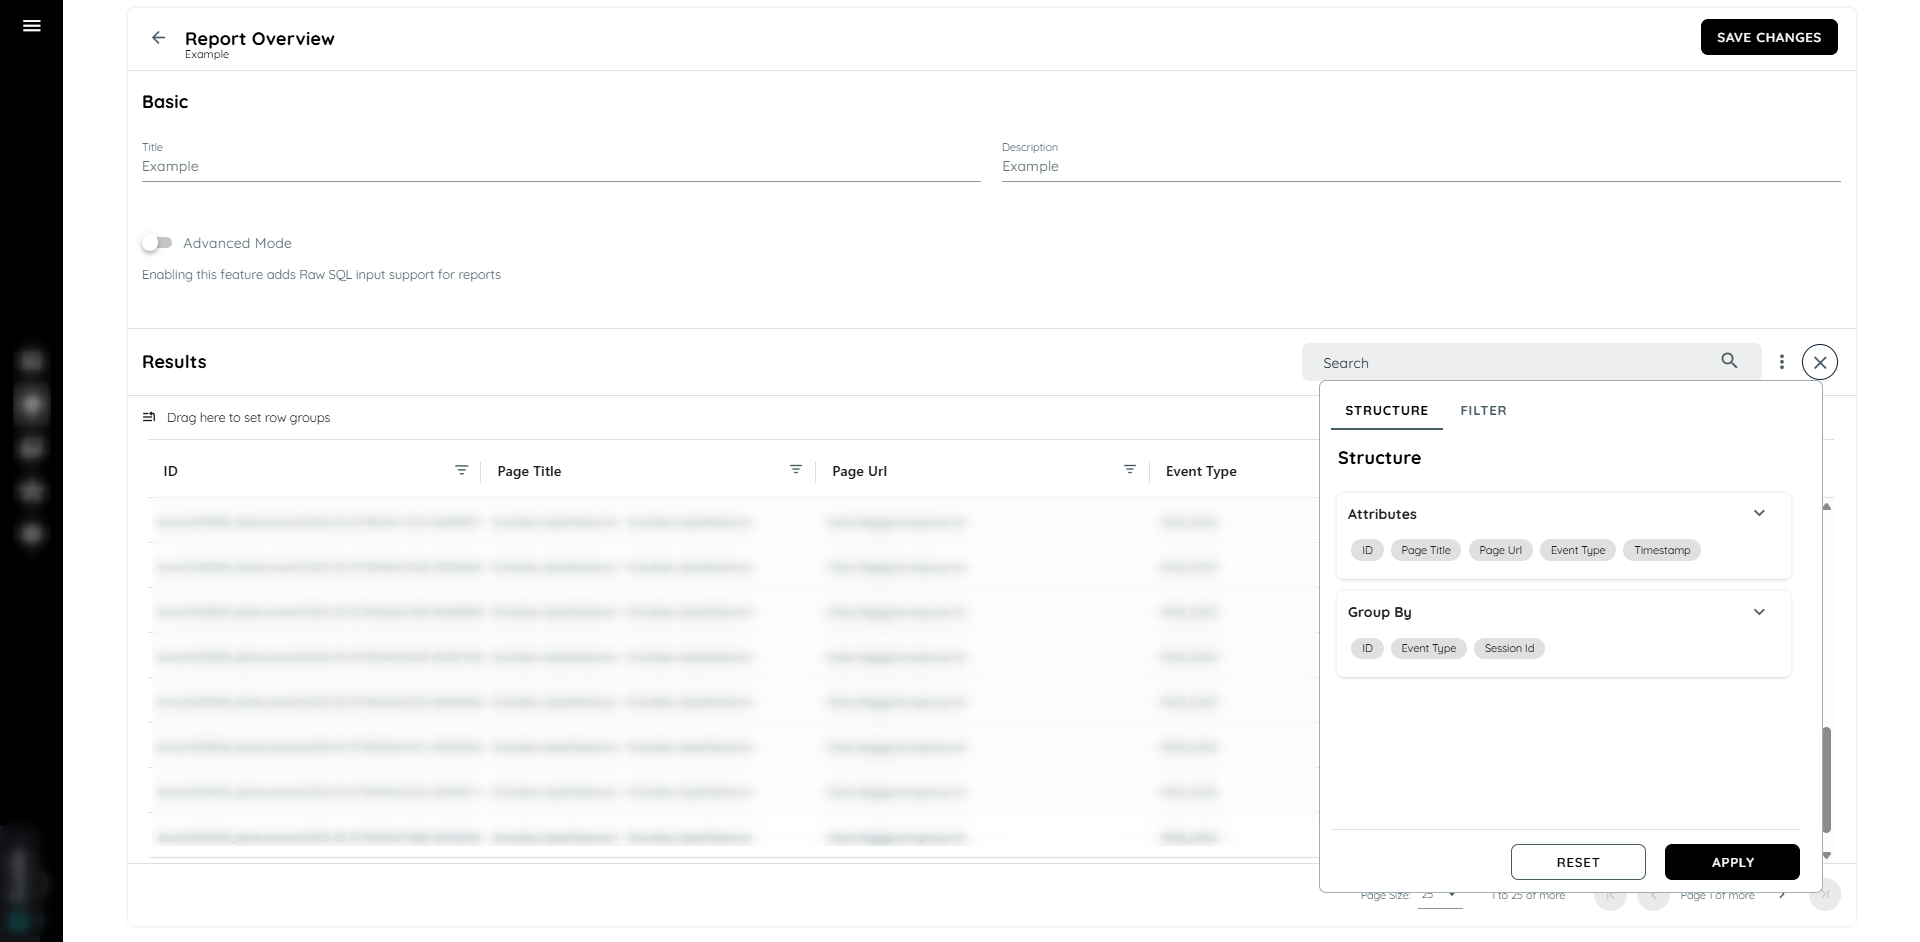
select attributes and groping data
Filter Tab: Add filters to refine your data view.
- Set a specific date range.
- Add filters to show specific values, such as filtering for events type marked as "LEFT_CLICK"
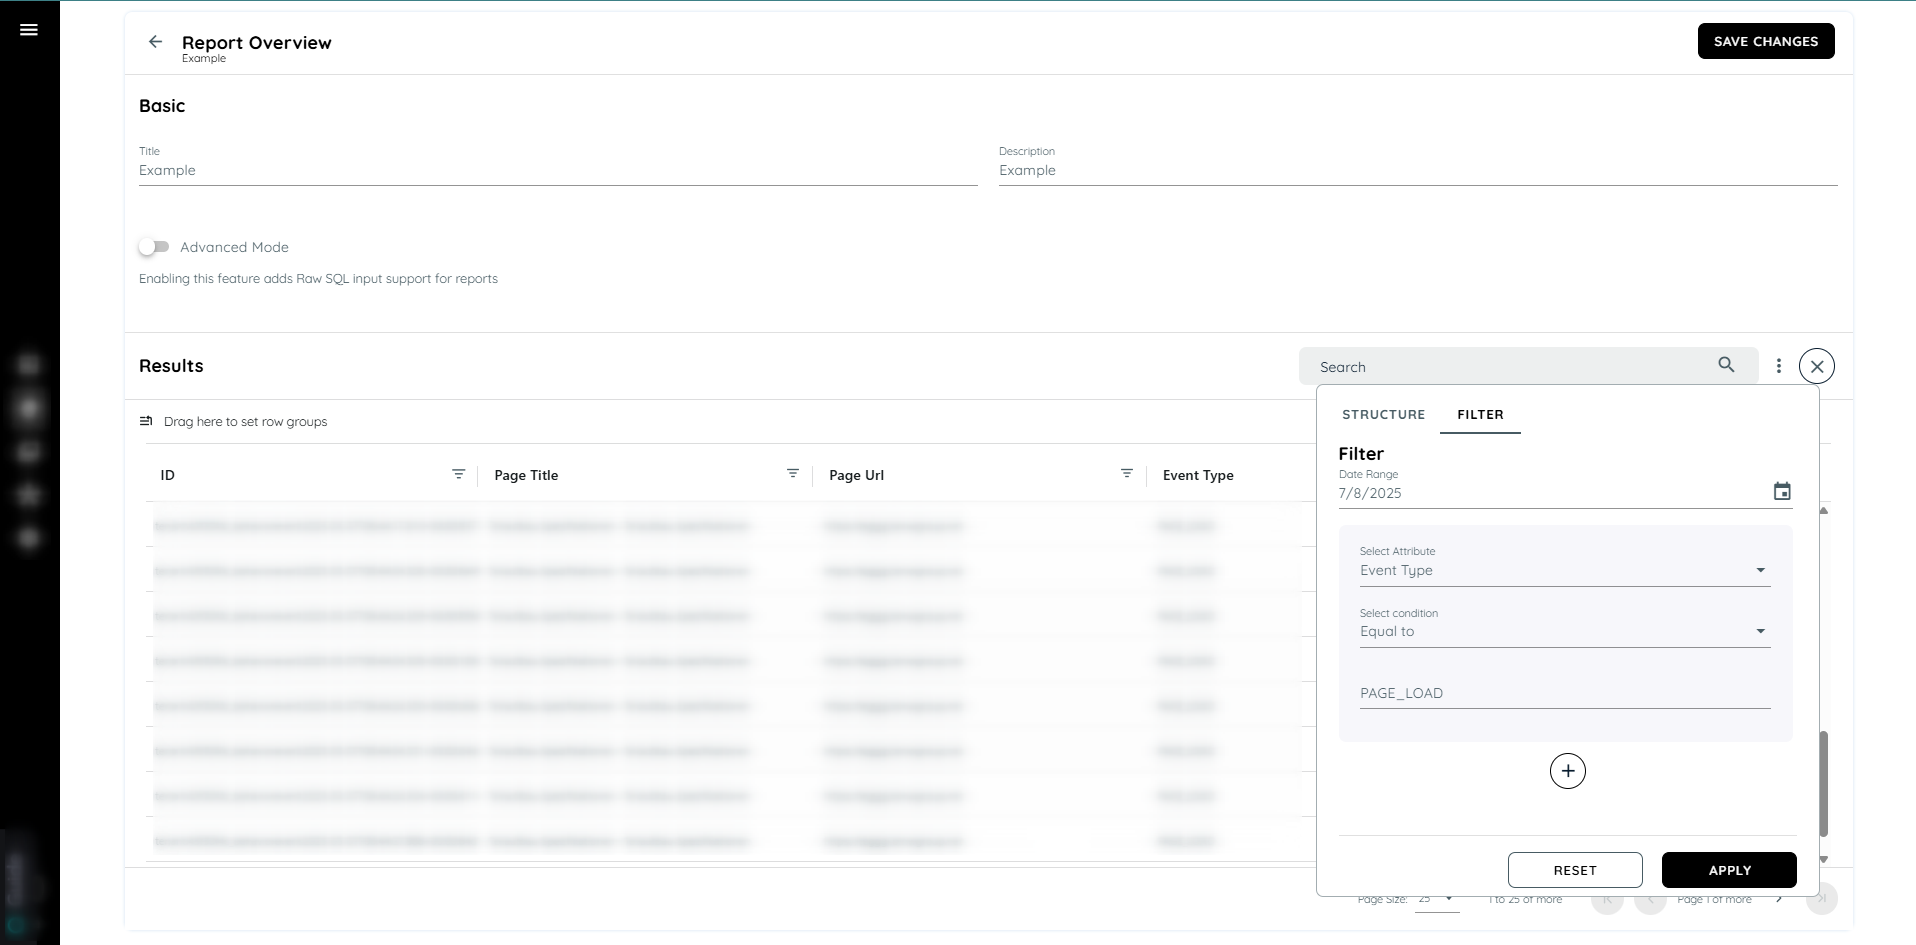
add specific date and filter
Export to Excel
Once configured, User can download the report as an Excel file, with all filters and groupings included in the exported version for consistent data views.
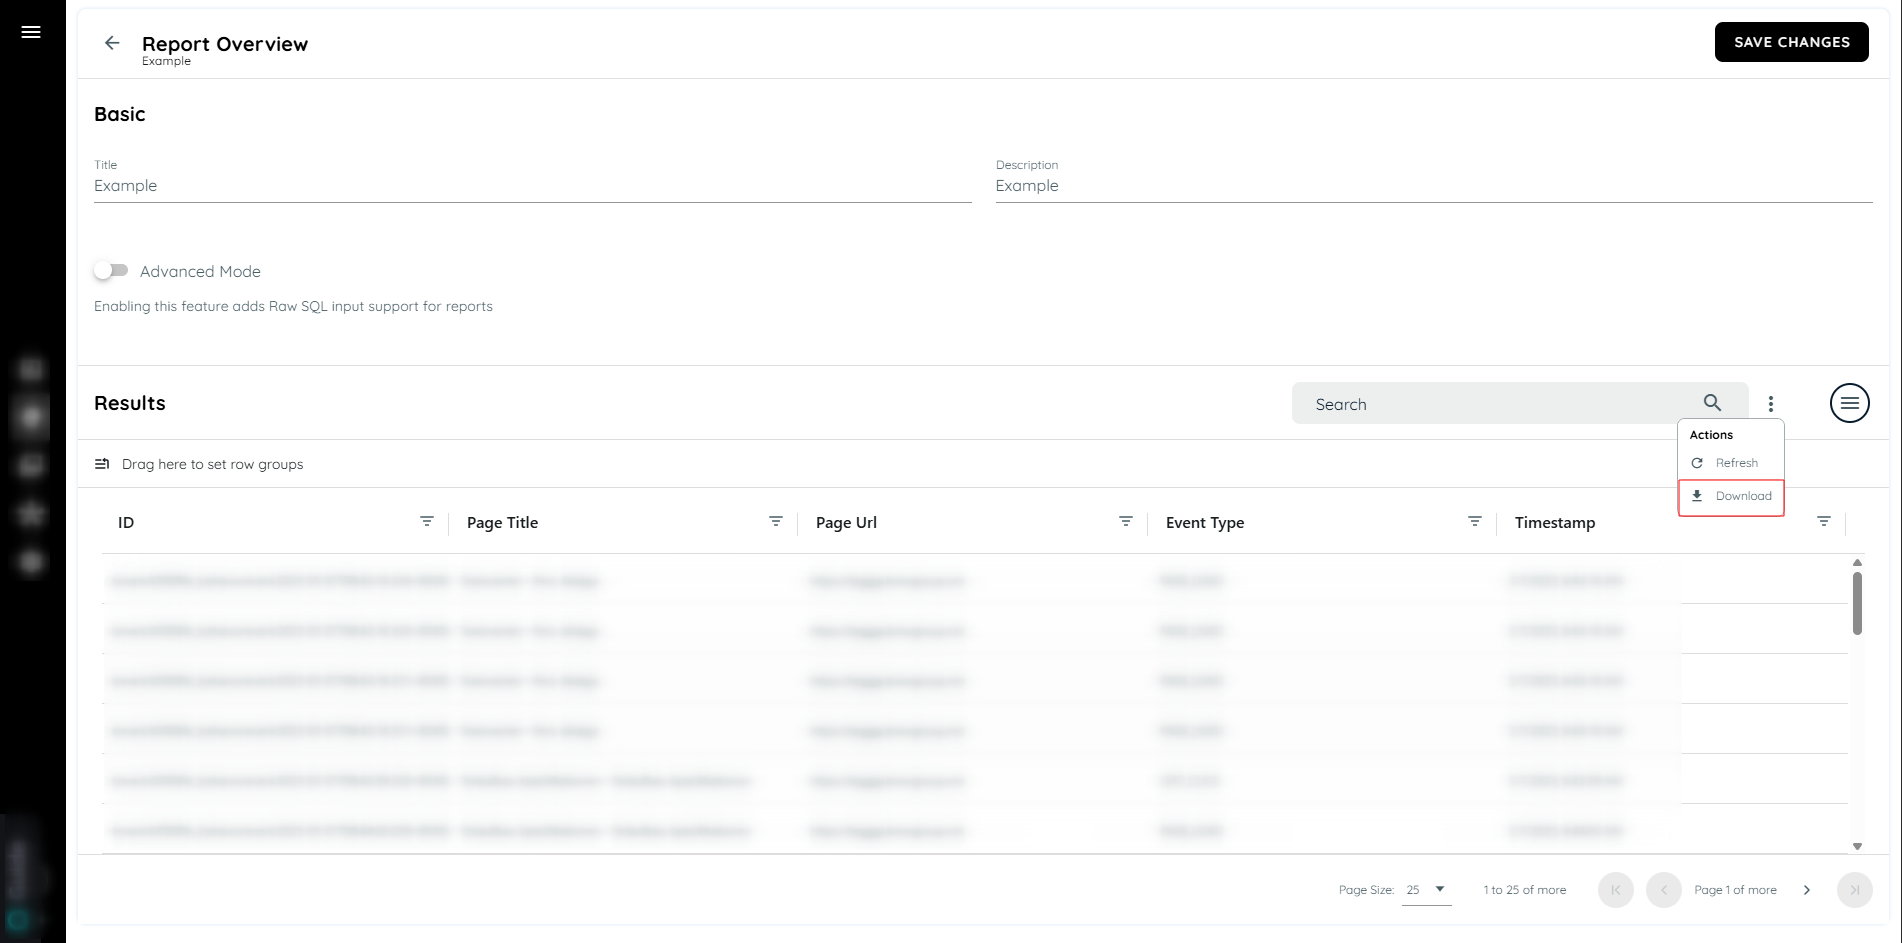
Download report
Save and Reload Reports
For frequently used configurations, you can save your report settings, including any filters and grouping options. Saved reports appear with your custom title and description, allowing you to reload them anytime without reconfiguration.
Saving report
Save Report View
Each saved report displays as a row, showing the title and description.
A three-dot button next to each report allows you to:
• Edit: Make changes to the saved configuration.
• View: Open the report to review the data.
• Delete: Remove the report if it’s no longer needed.
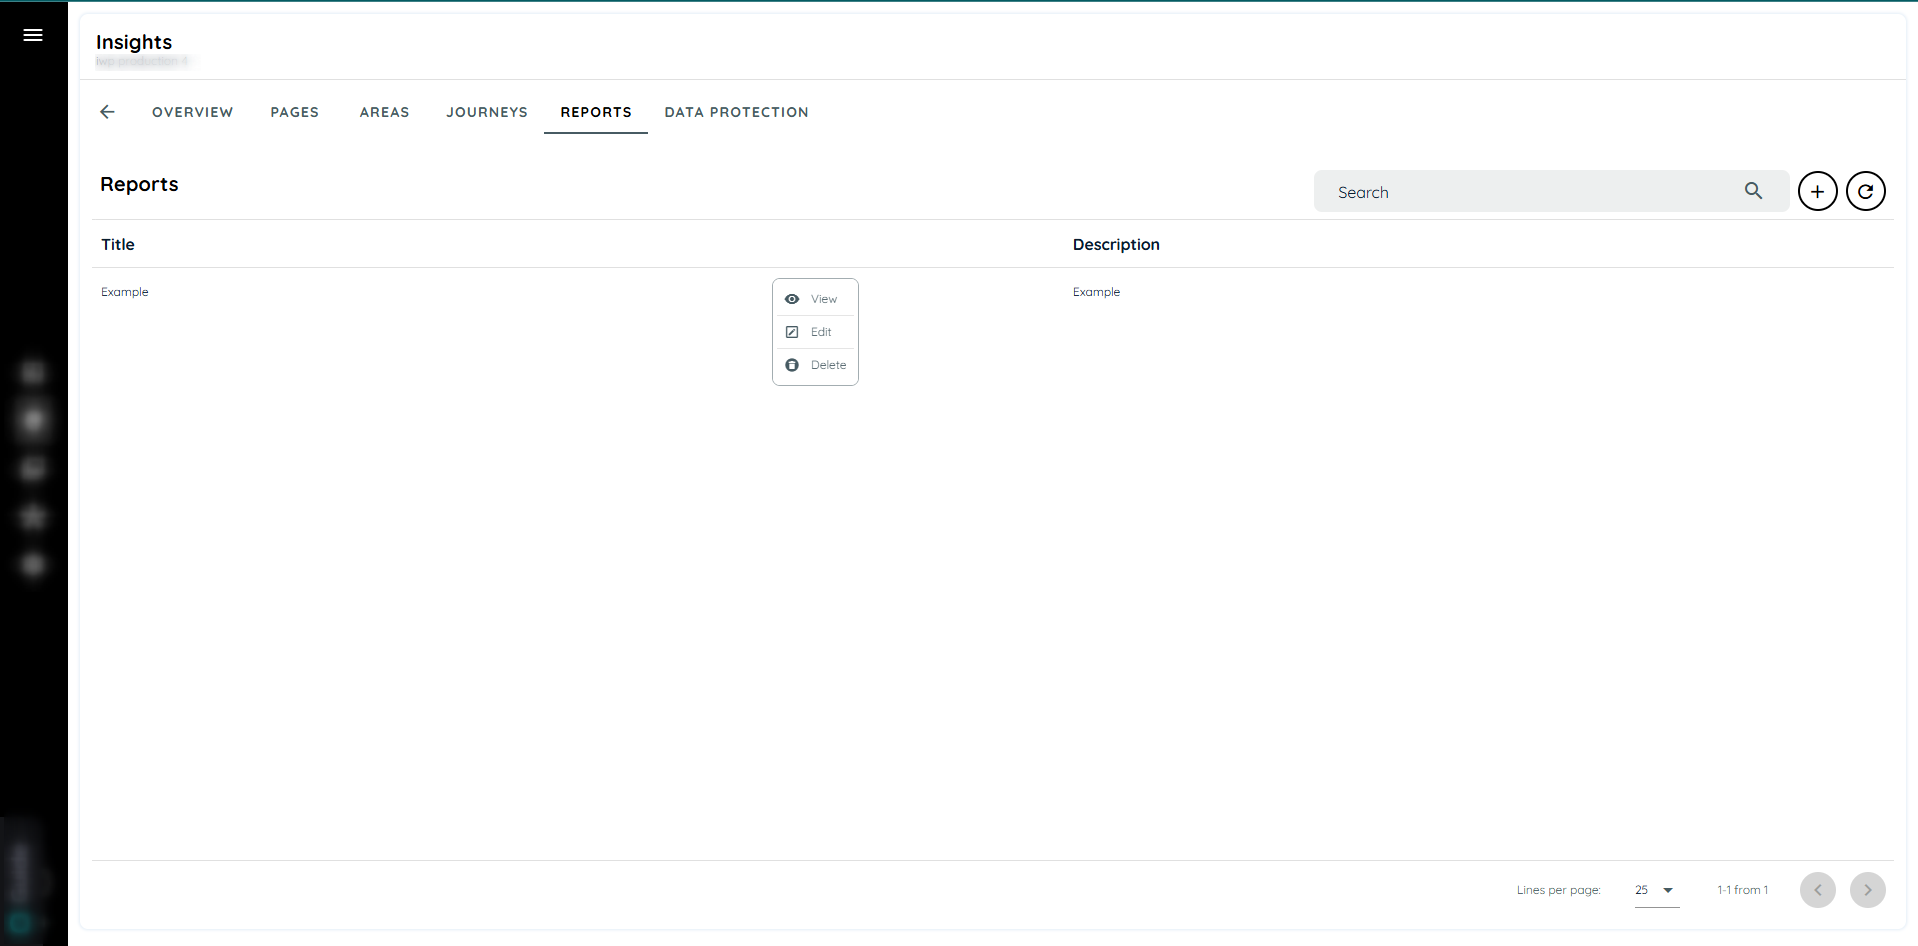
Save Report View
How to Use the Reports
Creating a Report:
- Open portal
- Navigate to the insights tab
- Click on the reports section.
- Click on plus icon to create a report
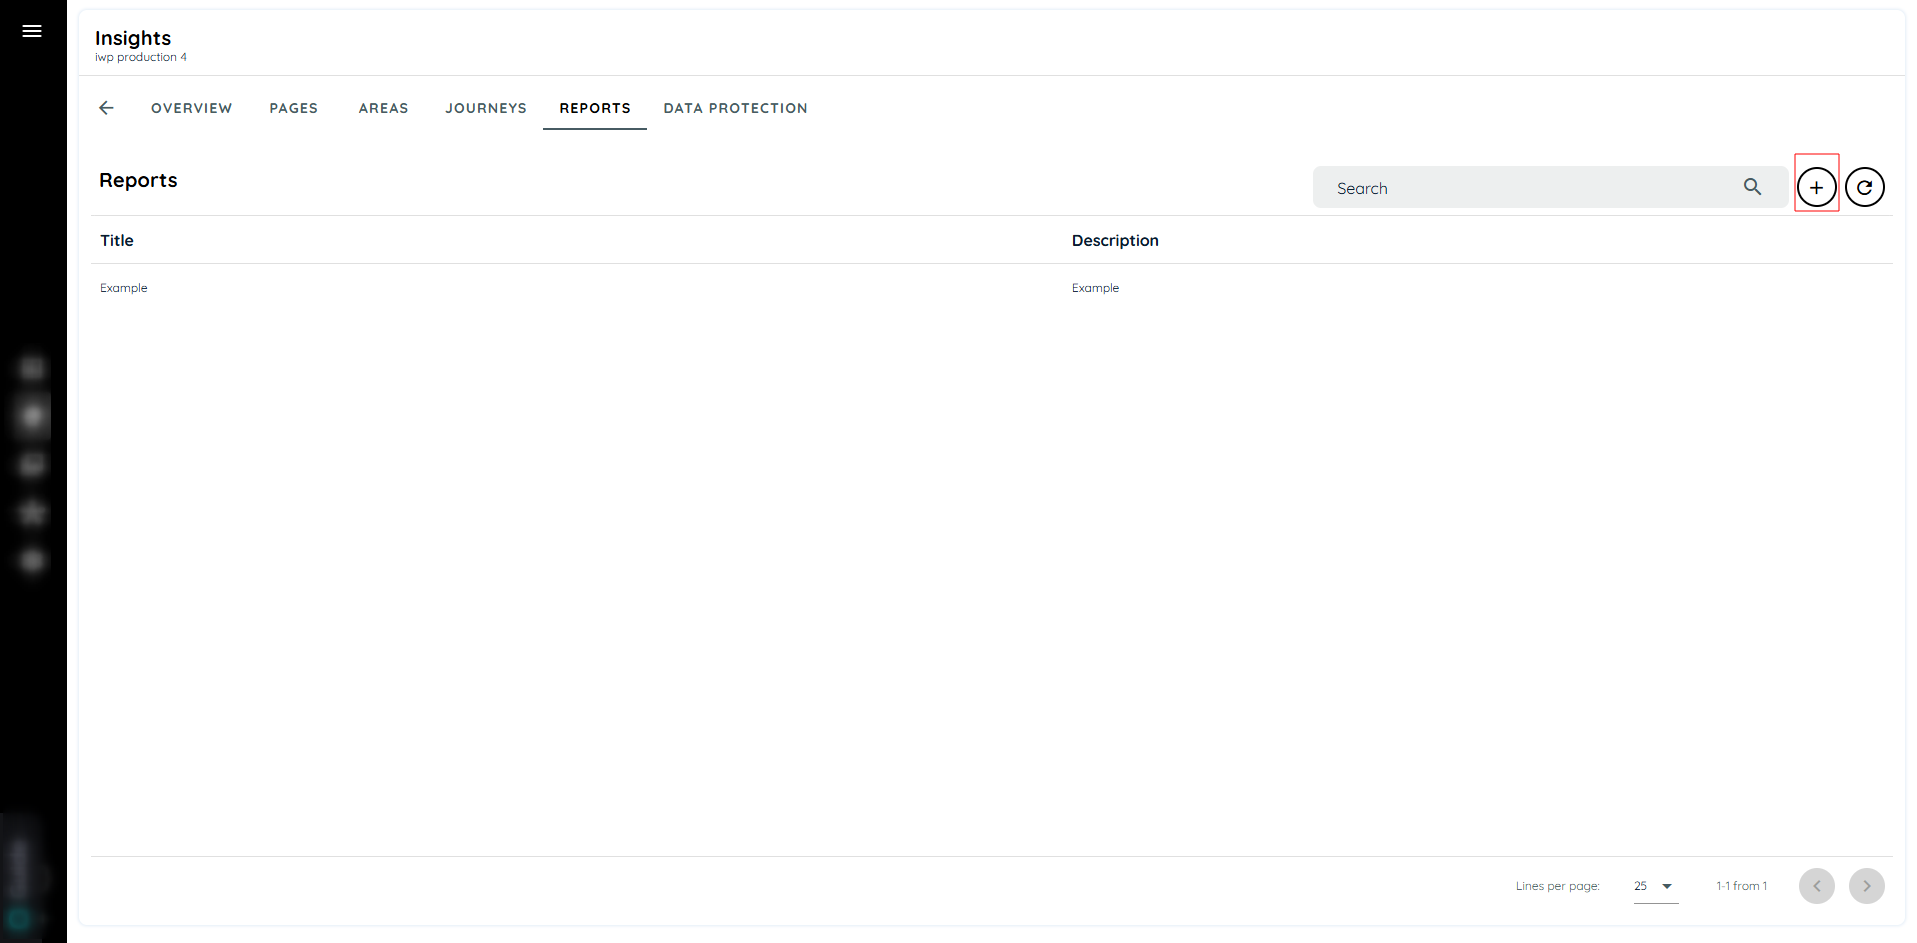
add a report
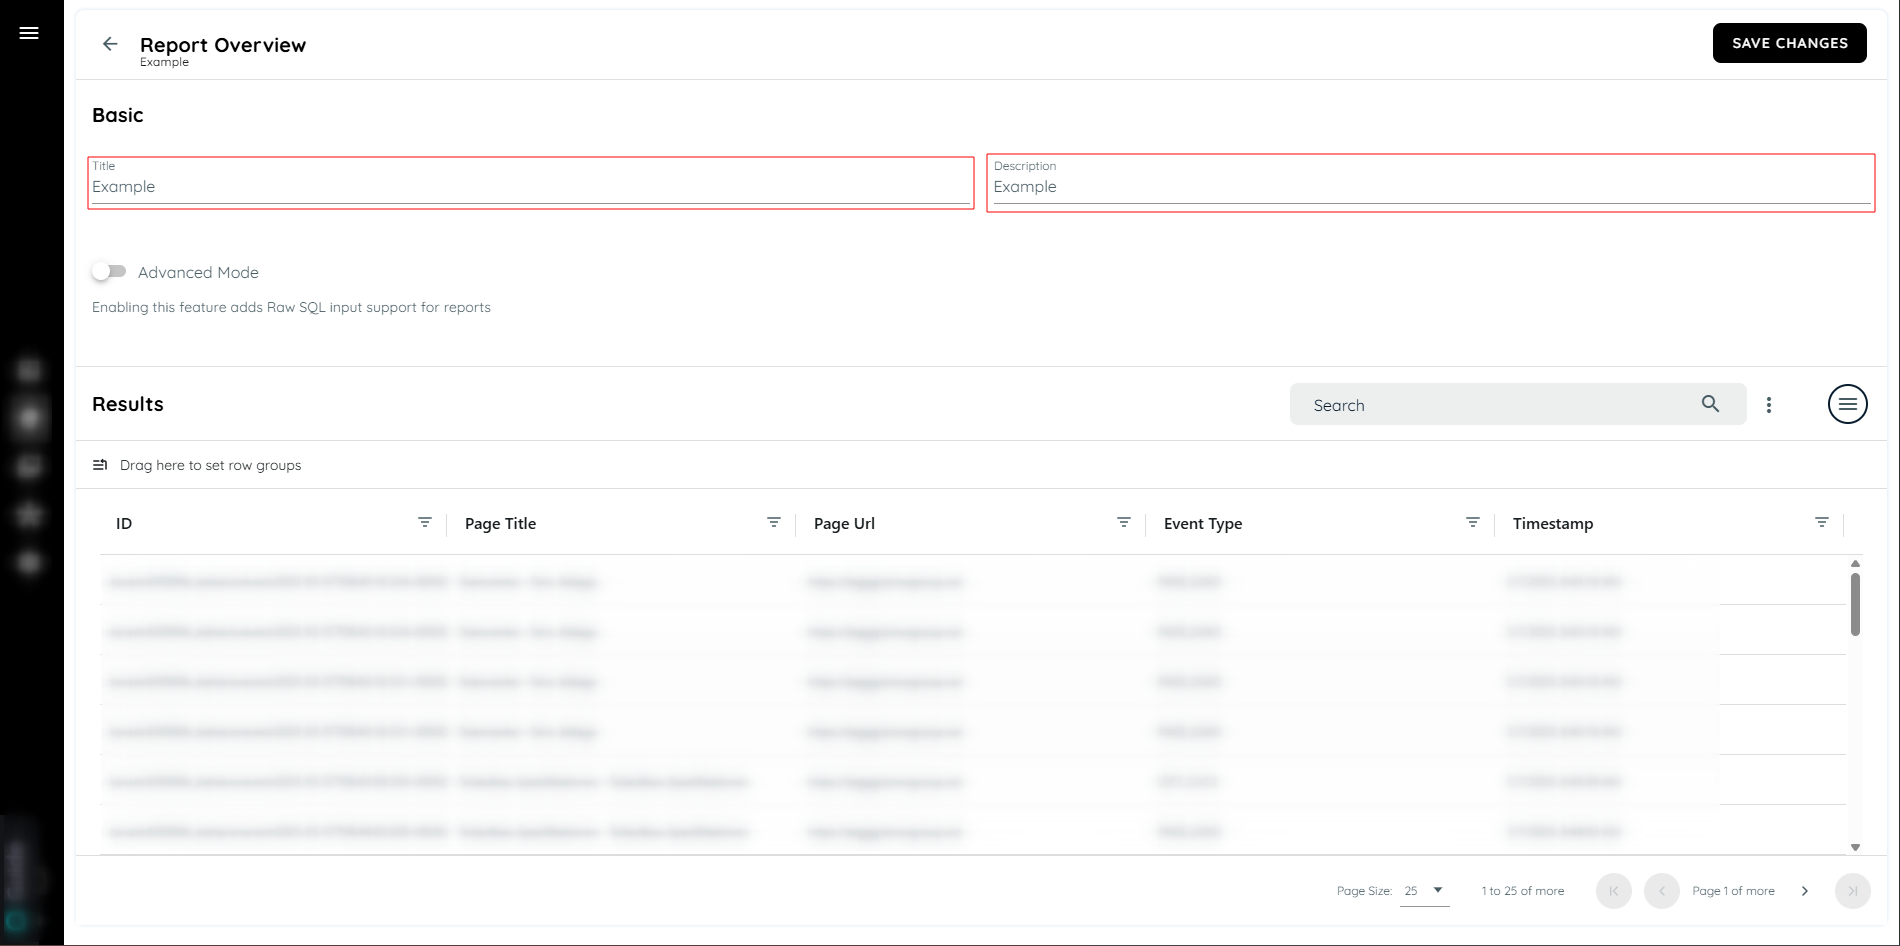
- Add a title and description
- Click on the side panel
- Click on the attributes user can select all attributes or select specific attribute
- If desired, apply grouping by selecting up to three fields.
- User can click on apply button it will apply the configuration or if desired add a filter

Select attributes and group by data
- Click on the filter tab
- Click on the date range to Specify the start and end dates.
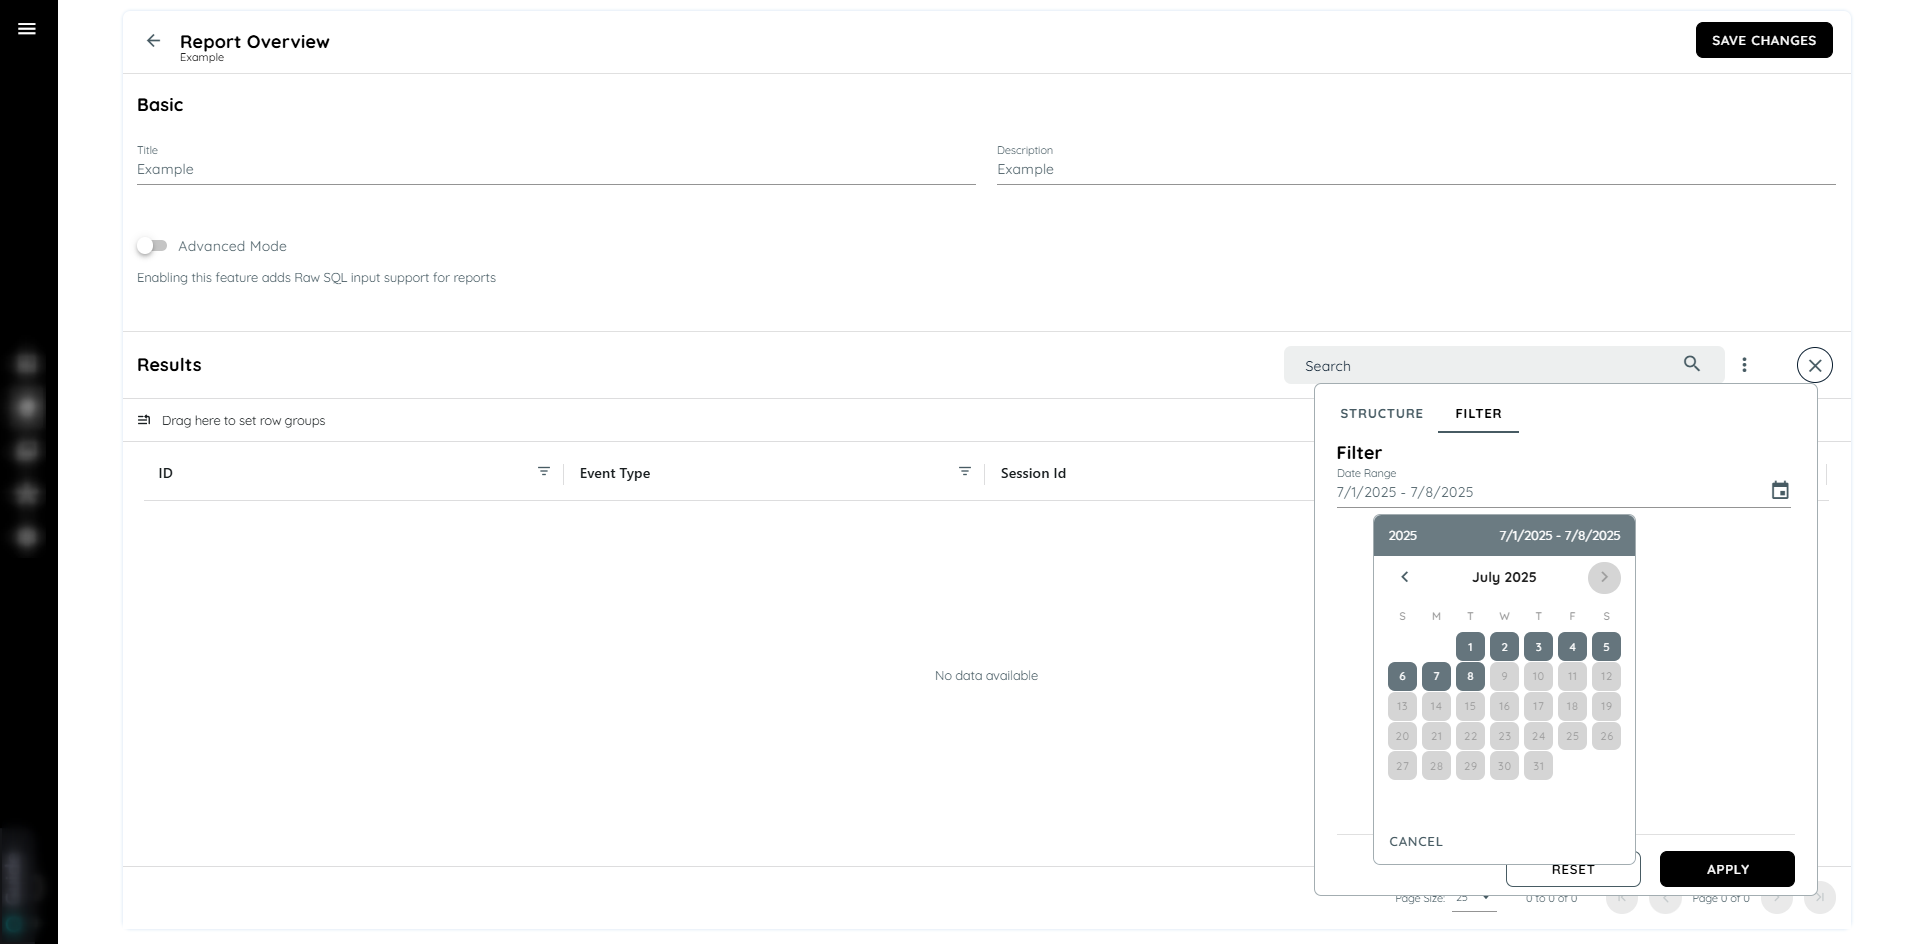
Select Date Range
- Click on the plus icon which is below the date range will add a filter
- Select an attribute and select the conditional operator then add a value.
- Click on apply button
- To delete a filter simply hover the filter there is an icon which will display on hover
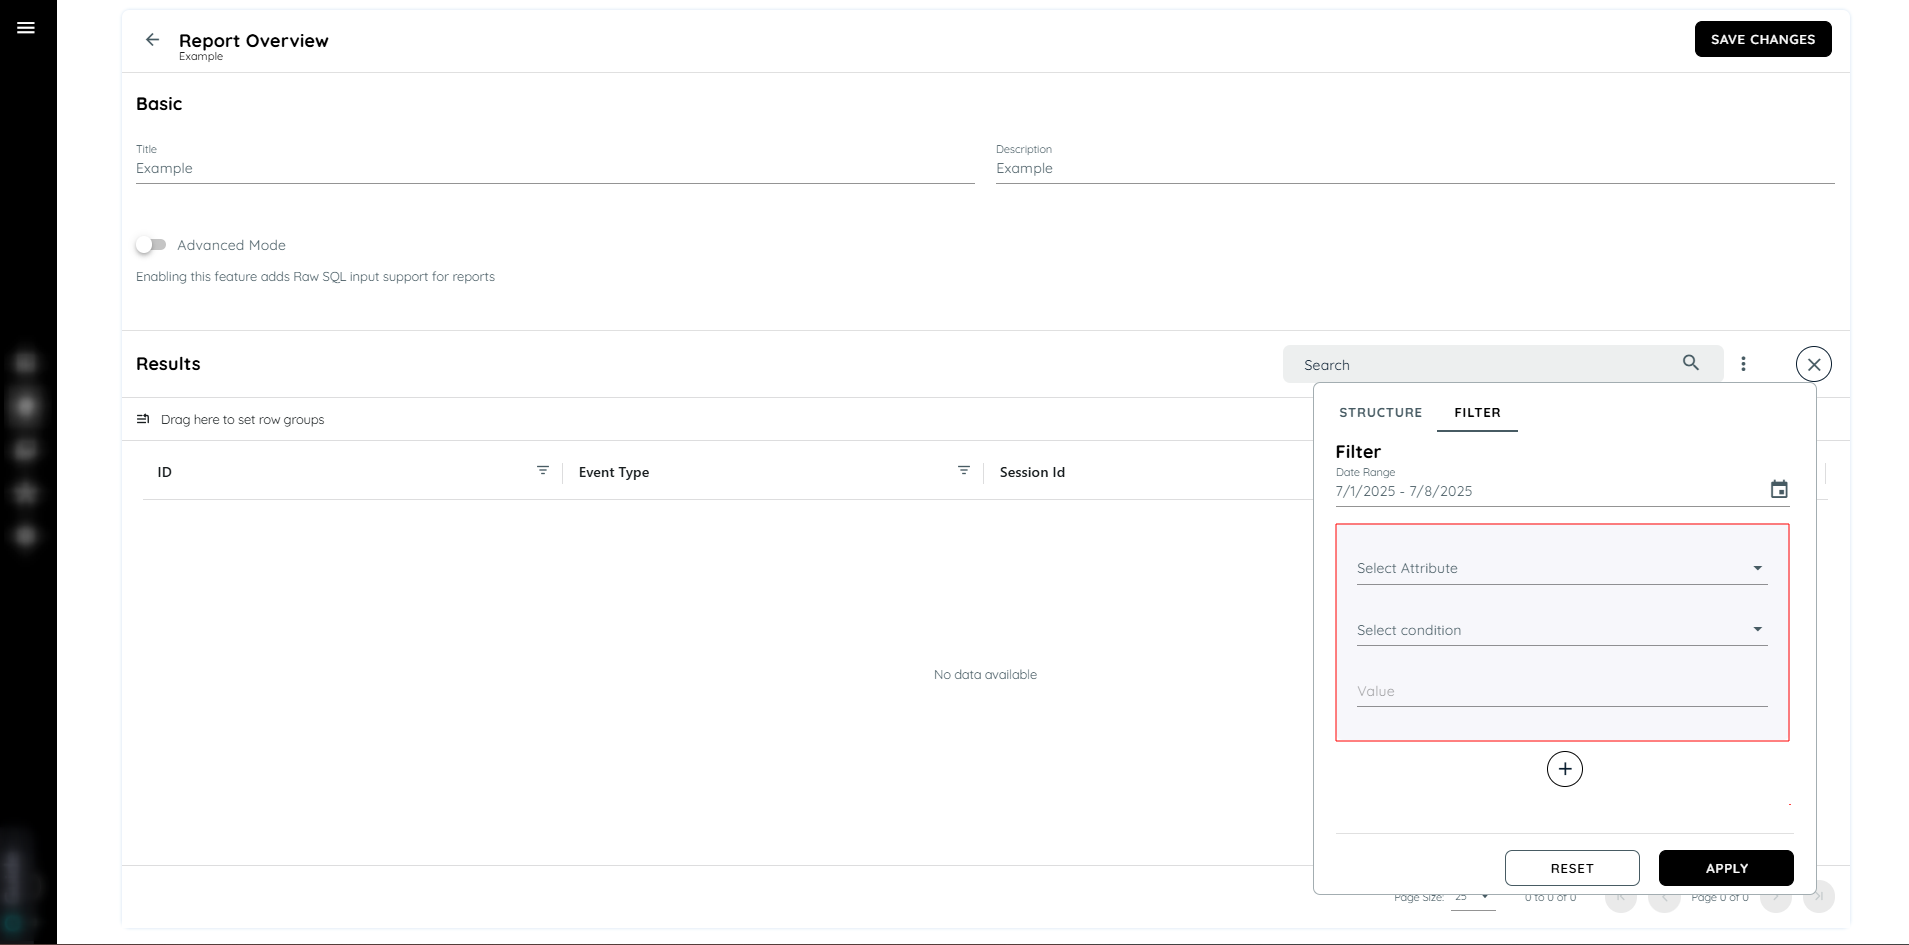
Add filter
Updated 8 months ago