Content Analytics
Routes
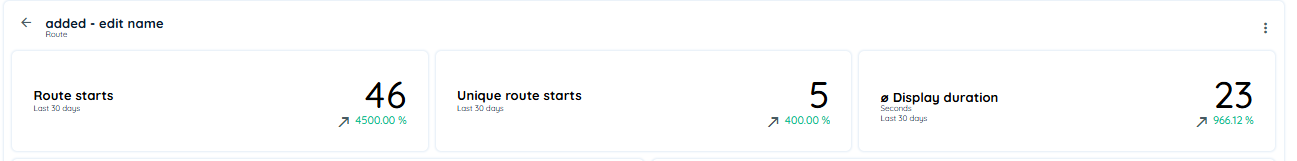
This shows analytics of selected route with time frame of last 30 days, last 90 days and all time, upon selection.
Route starts
This figure shows how often the selected route was displayed and the change in the figure in the selected time frame.
Unique route starts
This figure shows how often the selected route was displayed by different users and the change in the figure in the selected time frame.
Avg. Display Duration
This figure shows how long individual steps of the route were displayed on average and the change of the figure in the selected time frame.
Route Steps
The Route Journey visualization offers a dynamic and insightful representation of how users interact with each step in a Route. Unlike traditional linear progress views, this chart is designed to reflect actual user behavior throughout the journey.
for more details you can read this document. Route Steps
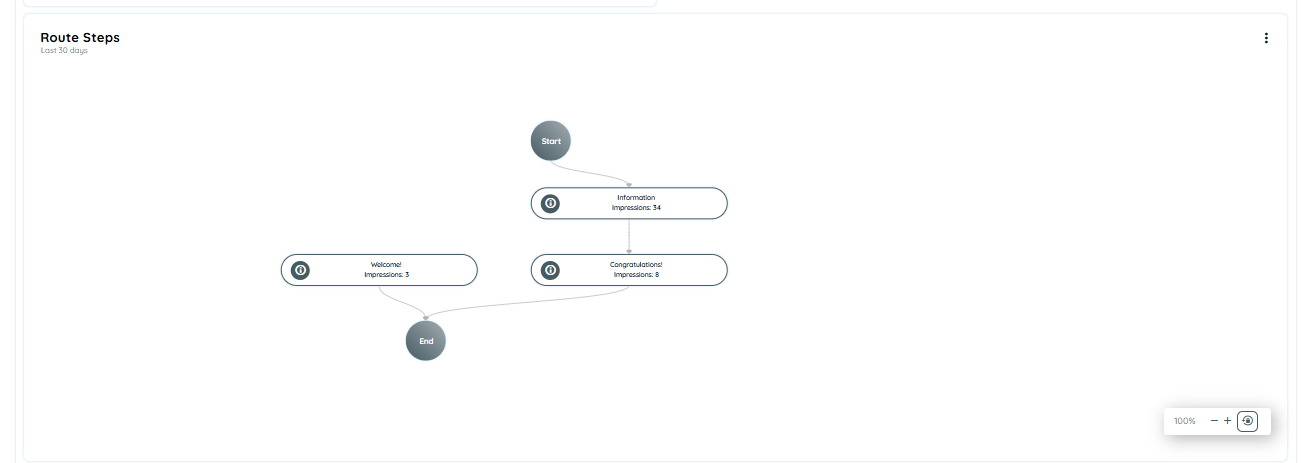
Route Steps
Posts
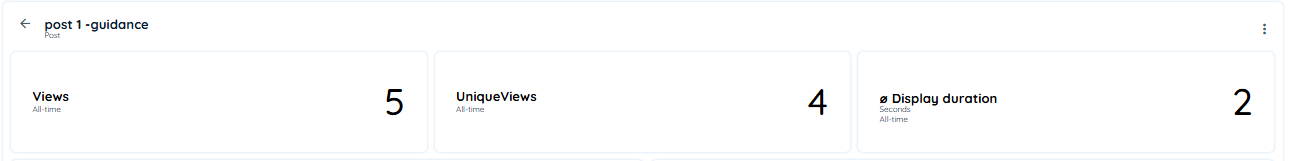
This shows analytics of selected Post with time frame of last 30 days, last 90 days and all time upon selection.
Views
This figure shows how often the selected post was displayed and the change in the figure in the selected time frame.
Unique views
This figure shows how often the selected post was displayed by different users and the change in the figure in the selected time frame.
Avg. Display Duration
This figure shows how long posts were displayed on average and the change in the figure in the selected time frame.
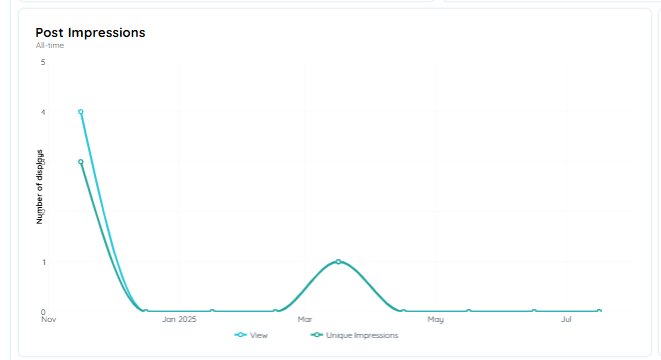
Post Impressions
The Post Impressions Chart is a line chart that visualizes how often posts have been viewed by users over a selected time period. It helps monitor both the reach and visibility of content across your application
Chart Details
This chart includes two distinct data lines:
- Impressions:
Represents the total number of impressions of posts by all users, including multiple views by the same user. - Unique Impressions:
Displays the number of impressions by unique users, ensuring that each user is counted only once per content item.
Show/Hide Data Lines:
User can click on the labels in the chart legend to toggle visibility of the Impressions and Unique Impressions lines.
Note: If an application is disabled content / application no longer exists within the tenant or workspace, its data will not be included in the chart results.
User Search Input
The User Search Input table provides insights into how users search for posts within the application. It displays the specific keywords users entered and how frequently those searches occurred.
Table Details
Each entry in the table includes:
Search Input: The exact keyword or phrase used by the user to search for posts.
Search Count: The number of times the specific keyword or phrase was searched.
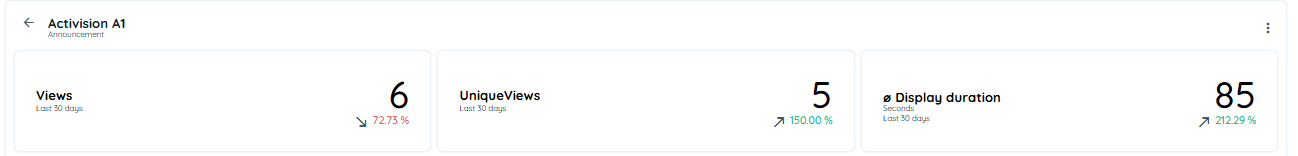
Announcement
This shows analytics of selected Announcement with time frame of last 30 days, last 90 days and all time upon selection.
Views
This figure shows how often the selected announcement was displayed and the change in the figure in the selected time frame.
Unique views
This figure shows how often the selected announcement was displayed by different users and the change in the figure in the selected time frame.
Avg. Display Duration
This figure shows how long announcement were displayed on average and the change in the figure in the selected time frame.
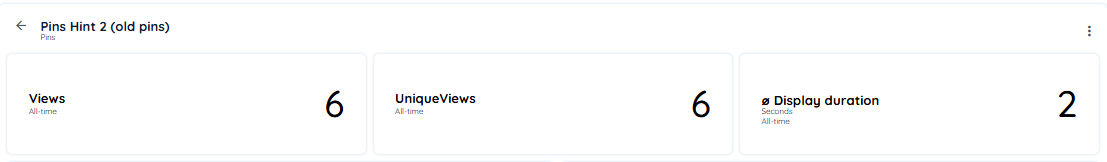
PINS
This shows analytics of selected pins with time frame of last 30 days, last 90 days and all time upon selection.
Views
This figure shows how often the selected pins was displayed and the change in the figure in the selected time frame.
Unique views
This figure shows how often the selected pins was displayed by different users and the change in the figure in the selected time frame.
Avg. Display Duration
This figure shows how long pins were displayed on average and the change in the figure in the selected time frame.
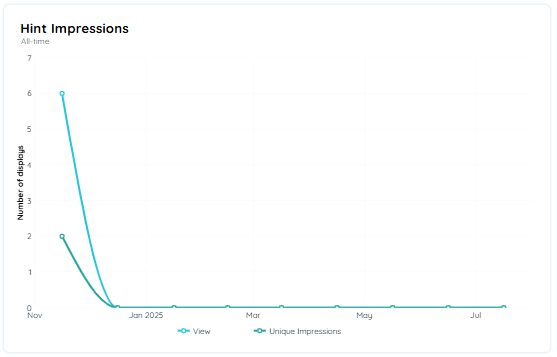
Pins Impressions
The Pins Impressions Chart is a line chart that visualizes how often pins have been viewed by users over a selected time period. It helps monitor both the reach and visibility of content across your application
Chart Details
This chart includes two distinct data lines:
- Impressions:
Represents the total number of impressions of pins by all users, including multiple views by the same user. - Unique Impressions:
Displays the number of impressions by unique users, ensuring that each user is counted only once per content item.
Updated 1 day ago