Discovery Analytics and Filters Guide
To access Discovered App Analytics and its functionality, open the portal and navigate to Discovery. The Discovery overview provides summary tiles, filters, app-level charts, country analytics, department and organizational unit breakdowns, and drill-down pages for deeper analysis.
Overview Tiles
The overview tiles summarize the key discovery counts for the selected time range. These tiles support Last 30 Days, Last 90 Days, and All Time views.
| Item | Description |
|---|---|
| Discovered Apps | Shows the number of applications discovered by users. An application is counted when it has at least 10 unique user records. |
| Countries | Shows the number of countries with at least 10 unique user records in the selected time range. |
| Users | Shows the total number of users who visited discovered applications in the selected time range. |

Discovery overview tiles for discovered apps, countries, and users.
Filters and Analytics Behavior
Discovery analytics supports Country, Organizational Unit, and Department filters. Selected filters apply to the Discovery Overview and app overview so the dashboard reflects the selected user segment.
| Item | Description |
|---|---|
| Country | Limits tables and charts to users from the selected country or countries. |
| Organizational Unit | Limits tables and charts to users from the selected organizational unit. |
| Department | Limits tables and charts to users from the selected department. |
| Combined filters | When multiple filters are selected, the page displays applications and metrics that match the combined selection. |
- Only applications with users matching the selected filters are displayed.
- Related analytics such as activity time, copy and paste count, and user metrics update dynamically based on the applied filters.
- Users can temporarily adjust filters locally in Discovery Overview for deeper analysis without changing the broader dashboard selection.
- Example: if Country is Germany, Organizational Unit is IT, and Department is Development, the Discovery Overview table and analytics show only applications and metrics for that subset of users.
Department and Organizational Unit Analytics
Users by Department
The Users by Department section shows the distribution of users across departments for Last 30 Days, Last 90 Days, and All Time. Users can switch between Chart and Table views. In Chart view, each bubble represents a department, and hovering over a bubble shows the user count and percentage contribution for that department.
Users by Organizational Unit
The Users by Organizational Unit section shows user distribution across organizational units for the selected time range. Each bubble represents an organizational unit, and the hover state shows the number of associated users and the percentage share for that organizational unit.
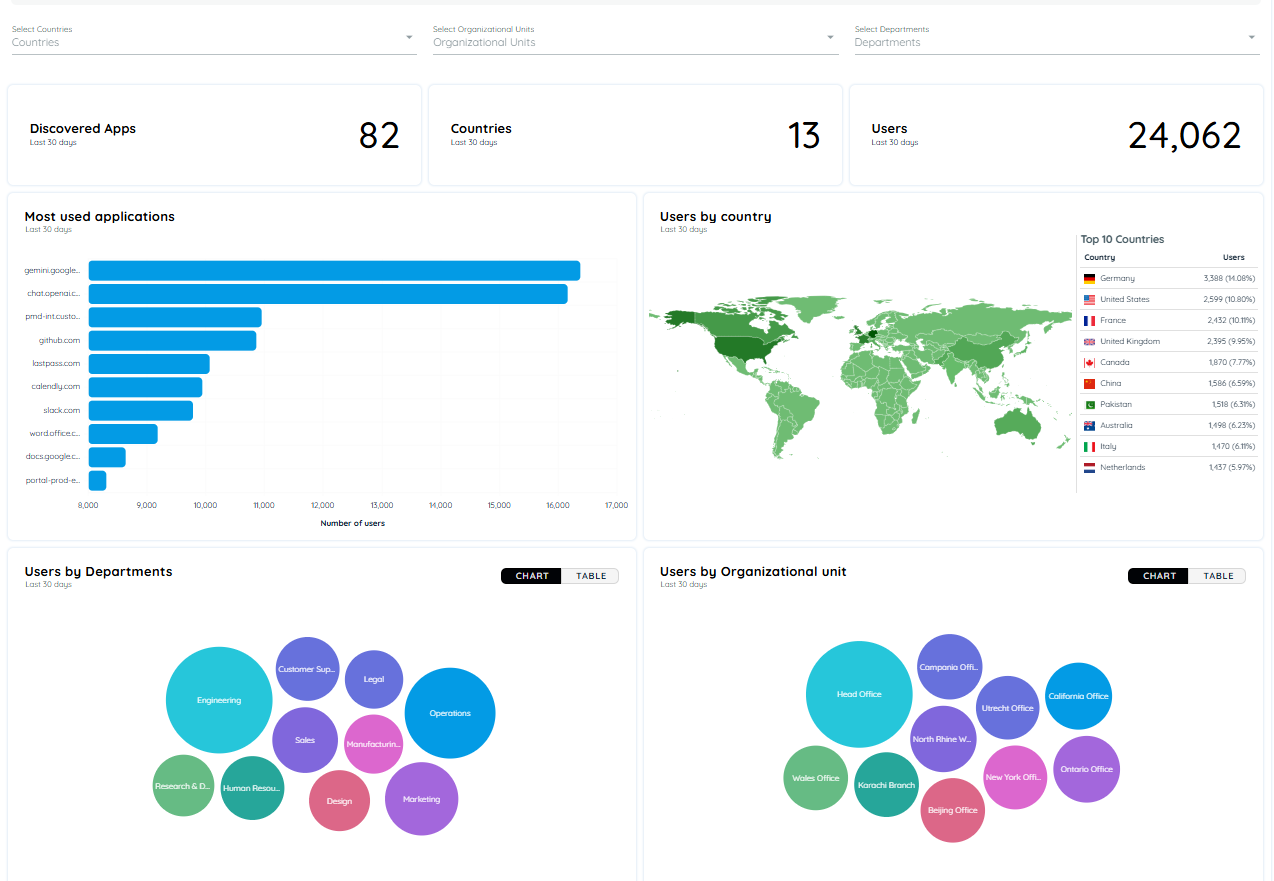
Discovery overview with department and organizational unit analytics.
Most Used Applications
The Most Used Applications bar chart displays the top five and bottom five applications based on user count. The chart supports Last 30 Days, Last 90 Days, and All Time views.
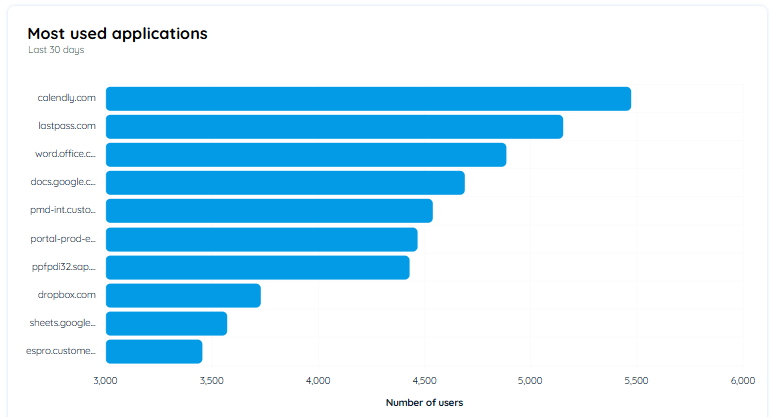
Most Used Applications bar chart.
Application Analytics Details
Users can open detailed application analytics by selecting an application from the Most Used Applications chart or by using the Analytics option in the context menu of the Discovered Applications tab. The top title displays the URL of the selected application.
Application analytics data is fetched for a specific application through the Refresh icon on that application analytics page. This avoids loading analytics for thousands of applications during the nightly job and keeps the detailed view focused on the selected application.
| Item | Description |
|---|---|
| Views | The page supports Last 30 Days, Last 90 Days, and All Time. Last 30 Days is the default view. |
| Filters | Country, Organizational Unit, and Department filters can be used separately or together. |
| Users | Shows users discovered within the selected application for the selected time range. |
| Average Activity Time | Calculates total activity time divided by total users. Durations display in minutes and seconds, such as 3:20. |
| Countries | Shows the countries from which users accessed the selected application. |
| Users Chart | Shows the number of users by date. |
| Users by Country | Shows the source countries of users who visited the application. |
| Distribution by Language | Shows language distribution based on the number of users. |
| Distribution by Browser | Shows browser distribution based on the number of users. |
| Application Usage | Shows application usage by date. |
| Distribution by Organizational Unit | Shows the distribution of organizational units for users of the selected application. |
Detailed analytics dashboard for a selected application.
Country Analytics
Users by Country
The Users by Country chart shows the countries from which users visited discovered applications. Countries with 10 or more distinct users are displayed. The chart supports Last 30 Days, Last 90 Days, and All Time views.
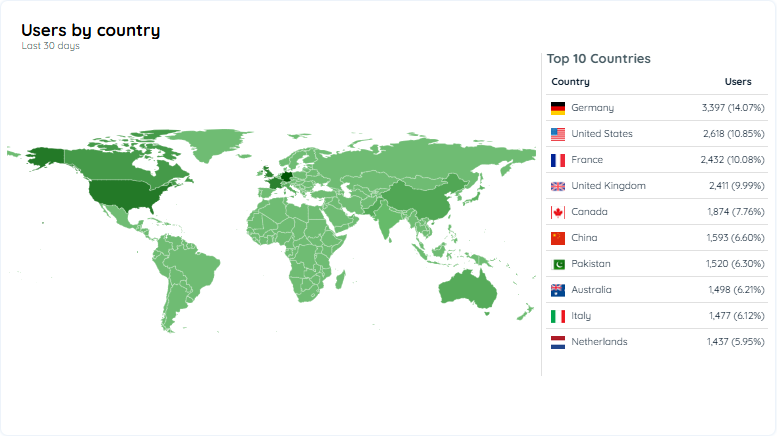
Users by Country map and top countries list.
Detailed Country Analytics
Selecting a country opens a detailed analytics page for that country. The page summarizes applications, users, average activity time, date-wise user activity, accessed capabilities, and a discovery app table for the selected country.
| Item | Description |
|---|---|
| Applications | Total number of applications associated with the selected country. |
| Users | Total number of users associated with the selected country. |
| Activity Time | Average activity time users spend in applications for the selected country. |
| User Chart | Date-wise user count for the selected country. |
| Capabilities | Capabilities accessed by users from the selected country, including total users. |
| Discovery App Table | Application, title, capabilities, users, and activity time for the selected country. |
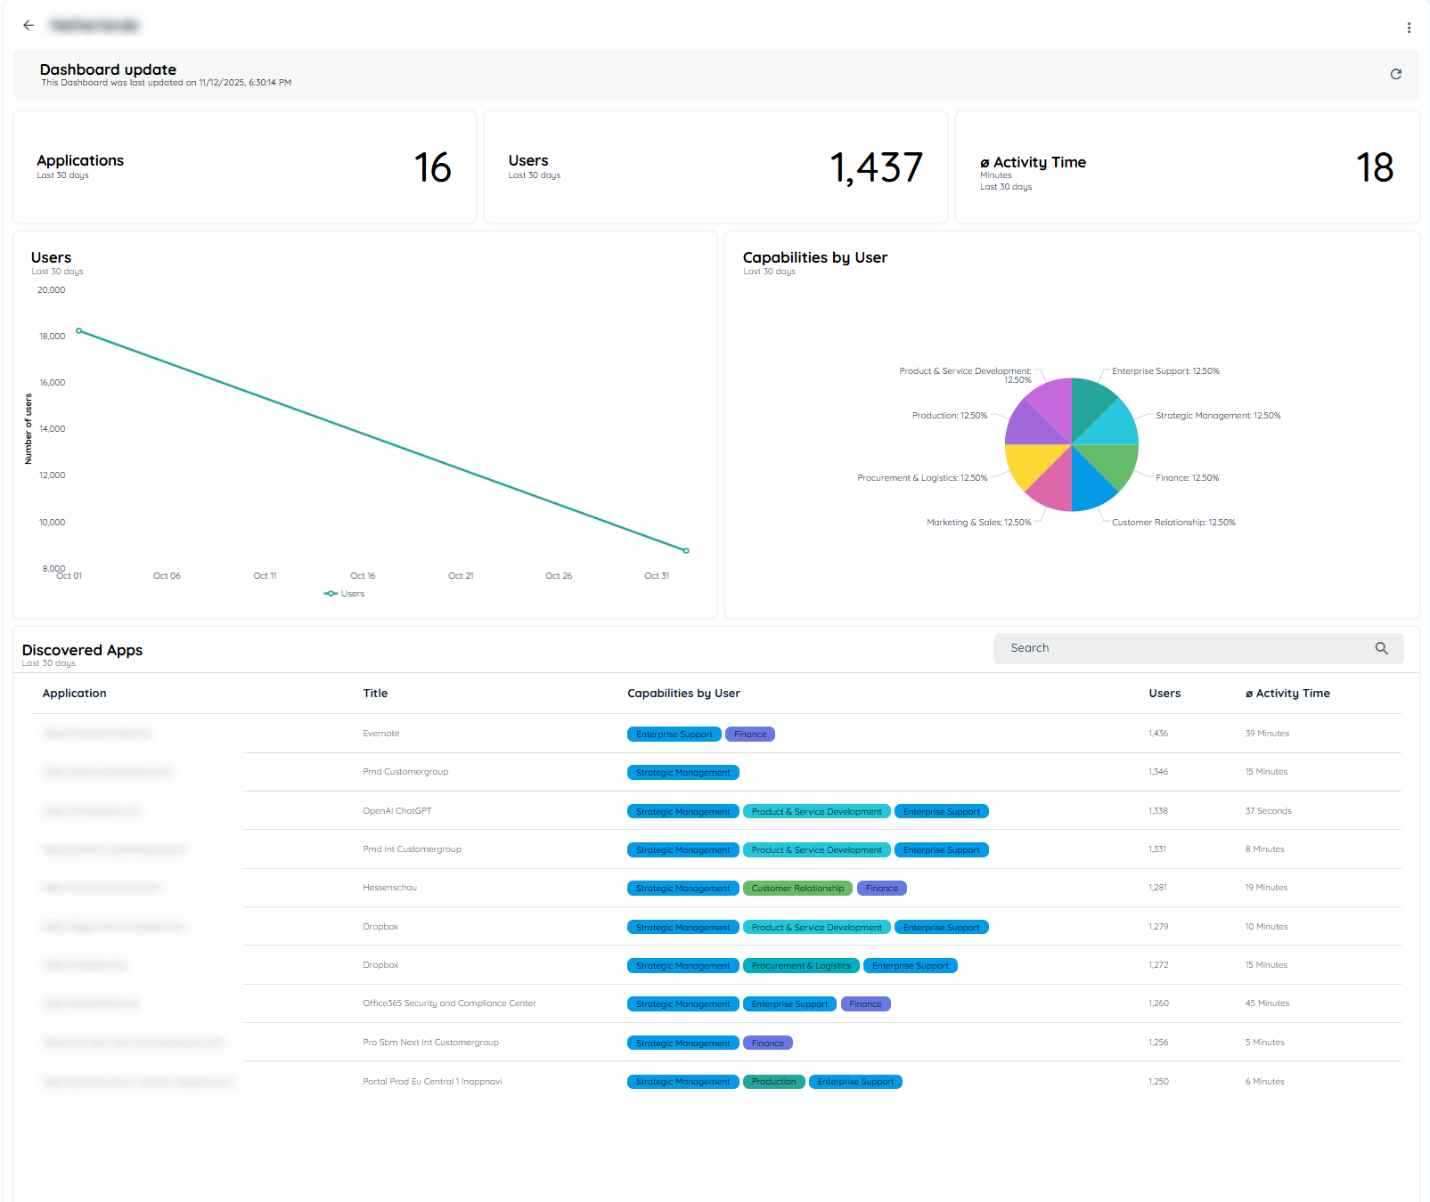
Detailed country analytics page.
Capability Analytics
Daily User Activity
The Daily User Activity chart shows the average time users allocate to each capability. The calculation is based on a fixed 9-hour workday, where 9 hours represents complete utilization or 100 percent of allocated time. The chart supports Last 30 Days, Last 90 Days, and All Time views.
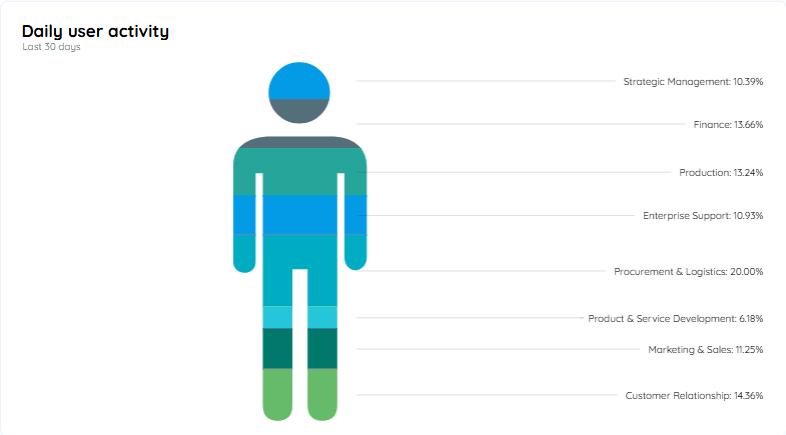
Daily User Activity capability distribution.
Users by Day and Capability
The Users by Day and Capability chart shows the percentage of users who used each capability on a daily basis. It also shows the average time for each capability and supports Last 30 Days, Last 90 Days, and All Time views.
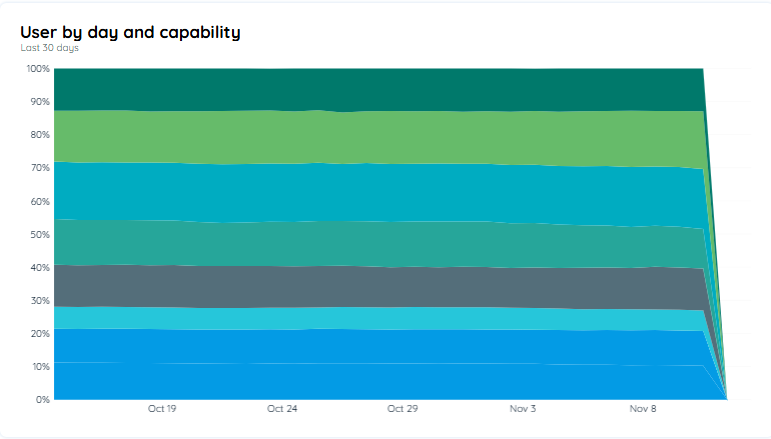
Users by Day and Capability chart.
Capabilities by Users
The Capabilities by Users chart shows user visitation frequency by capability. Capabilities with 10 or more distinct users are displayed. The chart supports Last 30 Days, Last 90 Days, and All Time views.
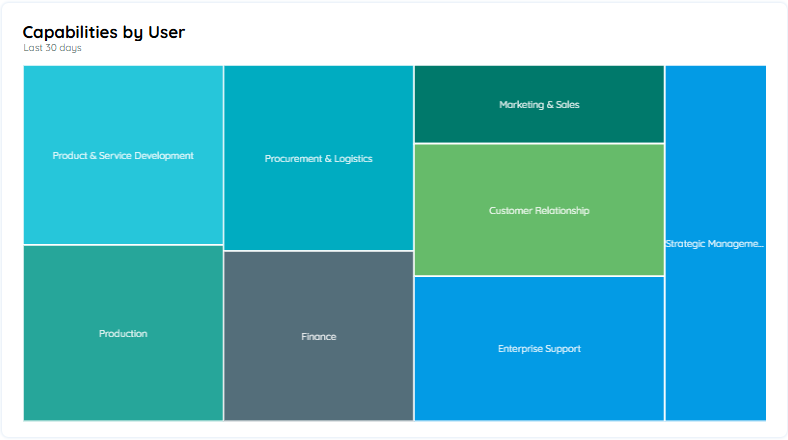
Capabilities by Users chart.
Detailed Capability Analytics
Selecting a capability opens a detailed analytics page for that capability. The page summarizes applications, users, average activity time, date-wise user activity, users by country, and a discovery app table for the selected capability.
| Item | Description |
|---|---|
| Applications | Total number of applications associated with the selected capability. |
| Users | Total number of users associated with the selected capability. |
| Activity Time | Average activity time users spend in the selected capability. |
| User Chart | Date-wise user count for the selected capability. |
| Users by Country | Countries that accessed the selected capability, including total users. |
| Discovery App Table | Application, title, users, and activity time for the selected capability. |
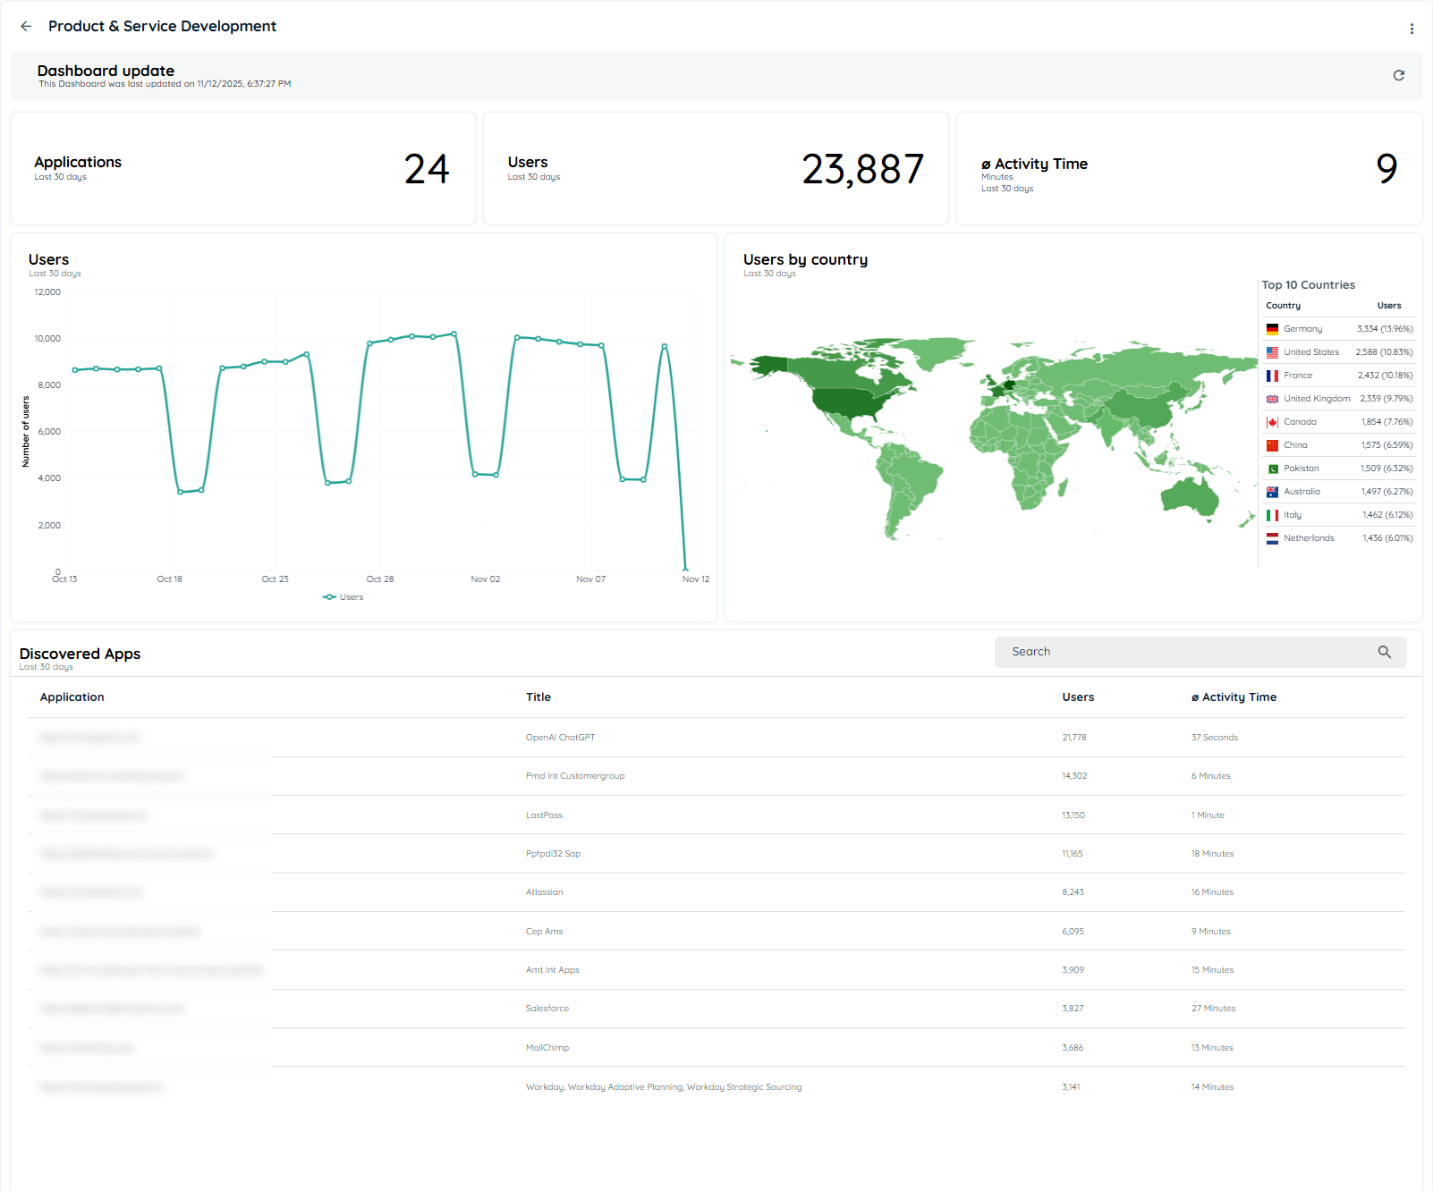
Detailed capability analytics page.
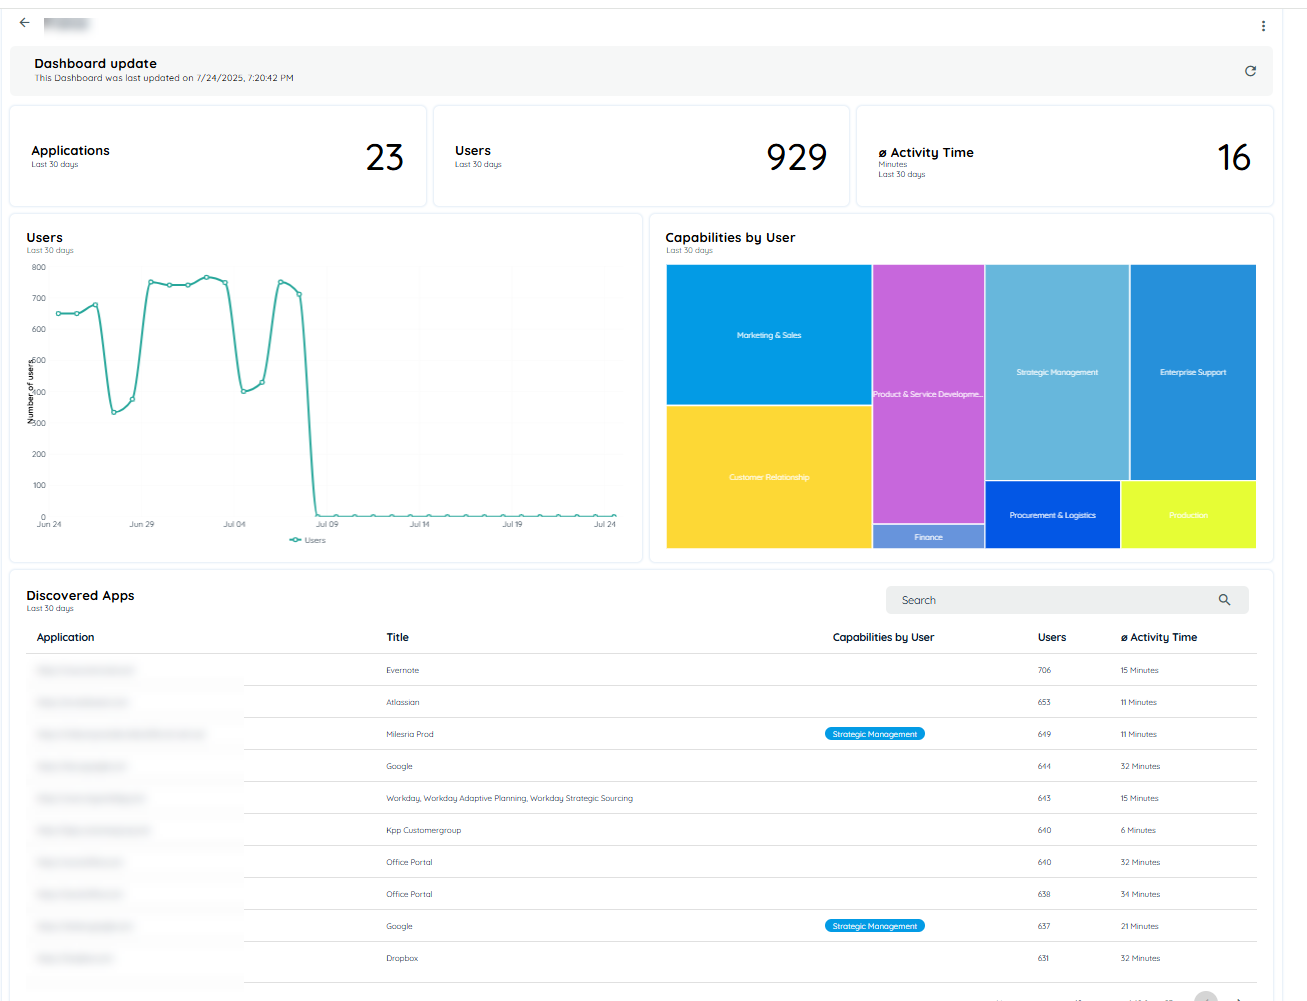
Capability detail view with users and application table.
Discovery Analytics and Filters Guide
Browser Analytics
The Browser chart shows browser distribution based on the number of users. Browsers with 10 or more users are displayed. The chart supports Last 30 Days, Last 90 Days, and All Time views.
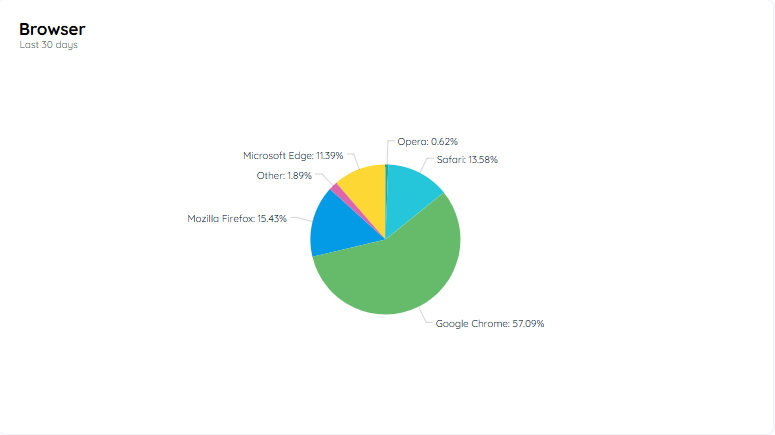
Browser distribution chart.
Validation Checklist
- The document title is specific and does not duplicate the existing Discovery Reports heading.
- Country, Organizational Unit, and Department filters are described clearly.
- The document explains that filters affect the Discovery Overview, app overview, tables, and related analytics.
- Time range behavior is described for Last 30 Days, Last 90 Days, and All Time where applicable.
- Screenshots include captions and accessible alt text.
- Drill-down behavior is covered for applications, countries, capabilities, and browser analytics.
Updated 21 days ago