
Managing and Monitoring Discovered Applications
Discovered Applications
This guide explains how to review and manage discovered applications in Discovery. It covers application details and assignments, SaaS catalog synchronization, copy and paste tracking, PII exposure detection, user segmentation, business capability suggestions, discovery data deletion, and recording filters.
For more information, see Apps Overview.
Prerequisites
You need access to the Discovery module. Tenant Owner permissions are required for tenant-wide Discovery settings, copy and paste tracking, PII exposure detection, and recording filters. To update an individual discovered application, you need permission to edit discovered applications.
Edit a Discovered App
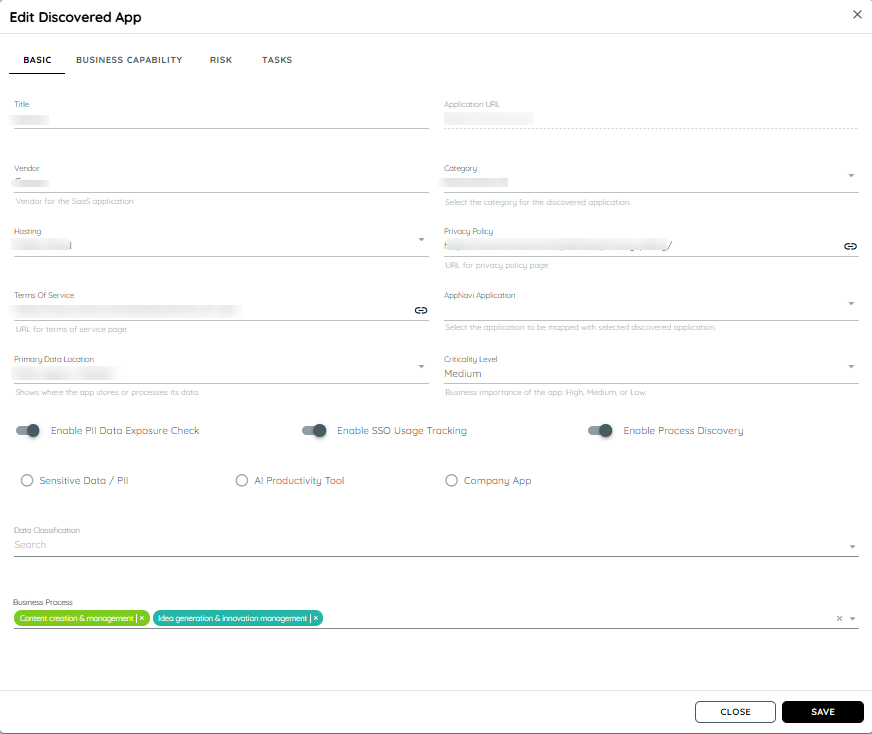
Basic settings for editing a discovered app.
Users can also assign business capabilities to a discovered app in the Business Capability tab.
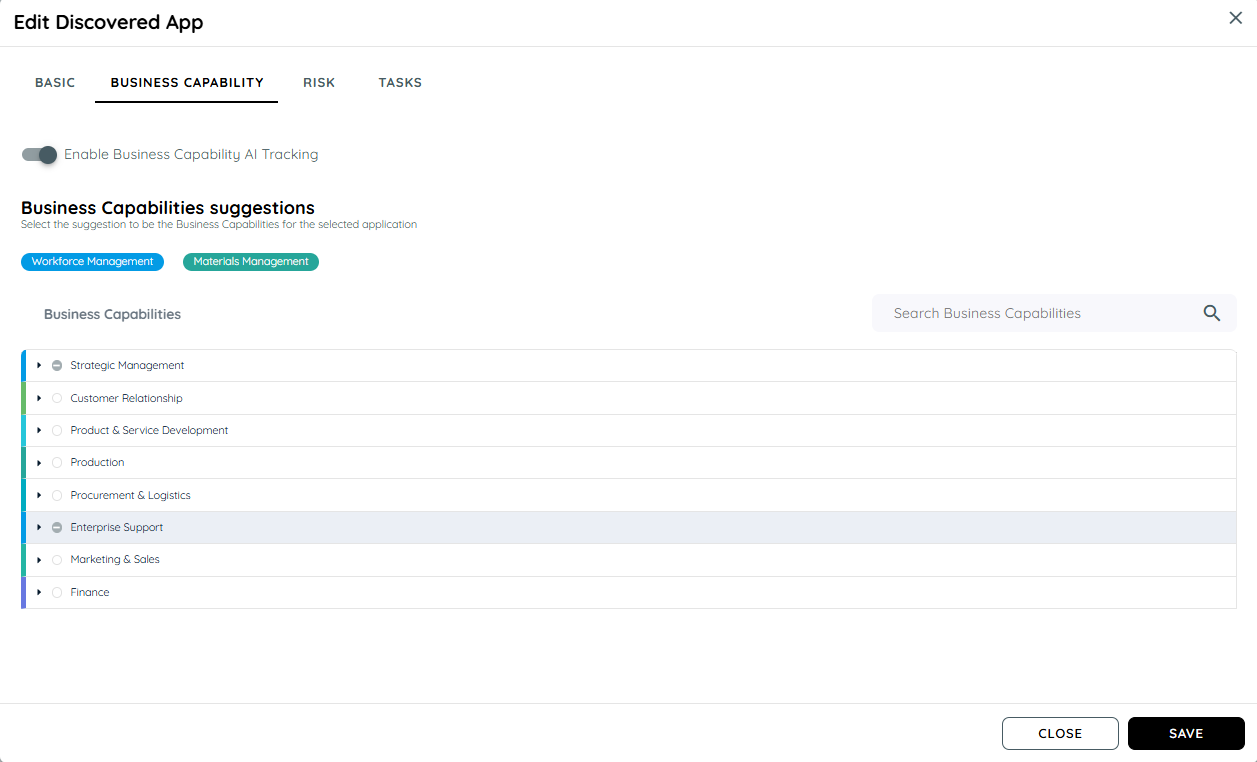
Business Capability tab for a discovered app.
Users can select security, compliance, and legal options in the Risk tab.
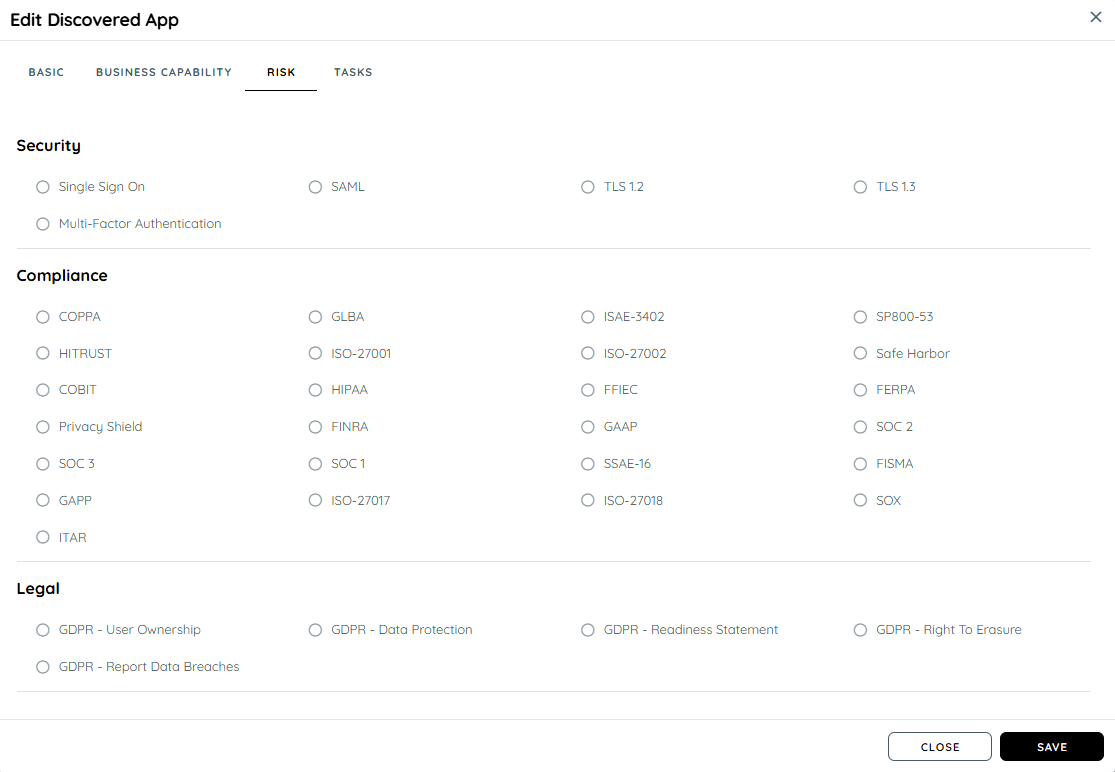
Risk tab for configuring security, compliance, and legal options.
Users can assign tasks related to a discovered app.
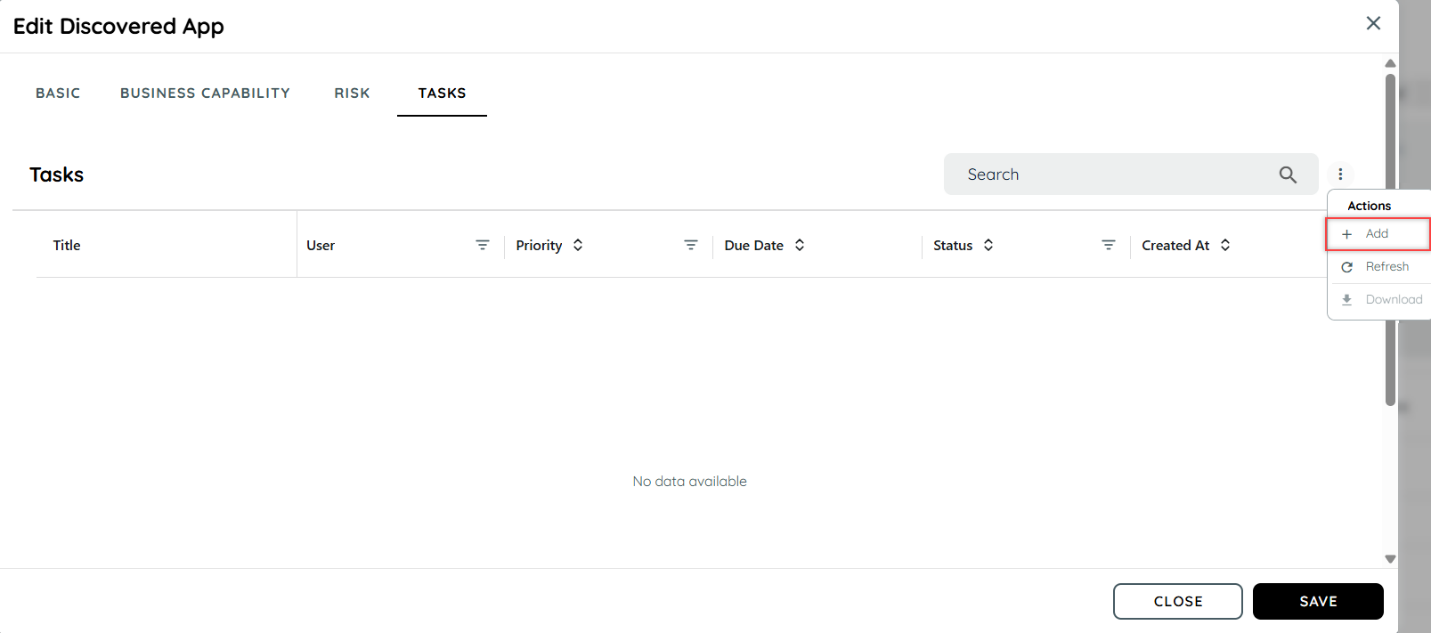
Tasks tab for managing tasks related to a discovered app.
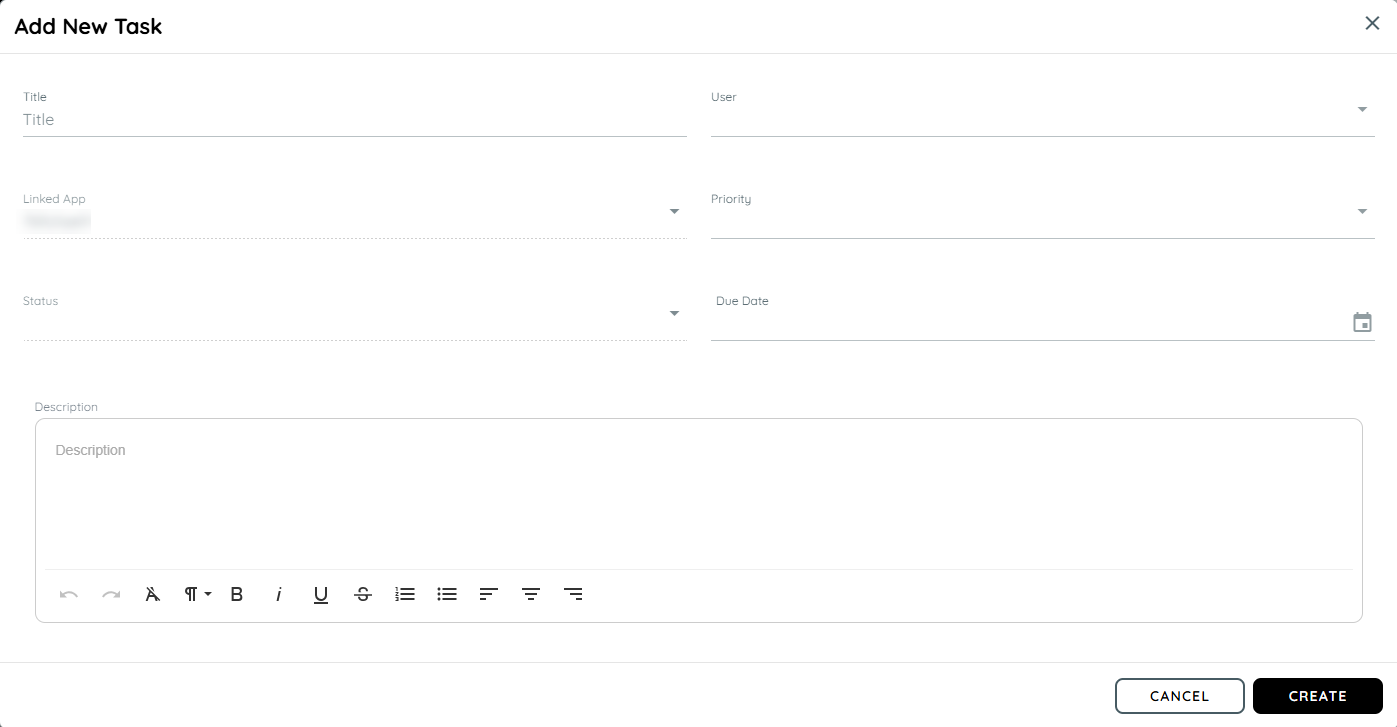
Add New Task form for creating a task related to a discovered app.
SaaS Applications
When an application is discovered through the Global SaaS catalog by the backend, it includes the details available in the catalog entry.
When the application is edited, the edit dialog displays the details from the Global SaaS application.
If a user edits any details, the changes are saved as tenant-specific values and are not overwritten when the application is rediscovered.
However, if the application is deleted and then rediscovered, it displays the original details and does not retain the user's modifications.
Copy and Paste Tracking
The system records the number of copy and paste events. Users can enable or disable this feature in the tenant Discovery settings. The Discovered Apps table includes columns for copy and paste events, and the recorded values are included in exports.
A Tenant Owner can enable copy and paste tracking in the Discovery settings. Once enabled, the system records copy and paste counts for discovered applications.
The Tenant Owner must first enable Discovery recording. After recording is enabled, the Tenant Owner can enable the Copy/Paste Tracking toggle to start recording copy and paste events.
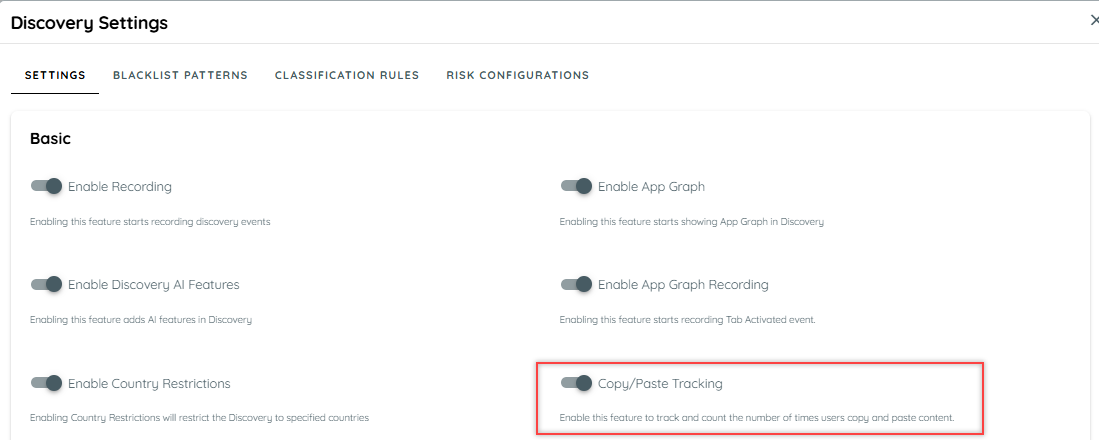
Discovery settings with Copy/Paste Tracking enabled.
When copy and paste tracking is enabled, events are recorded for all discovered applications.
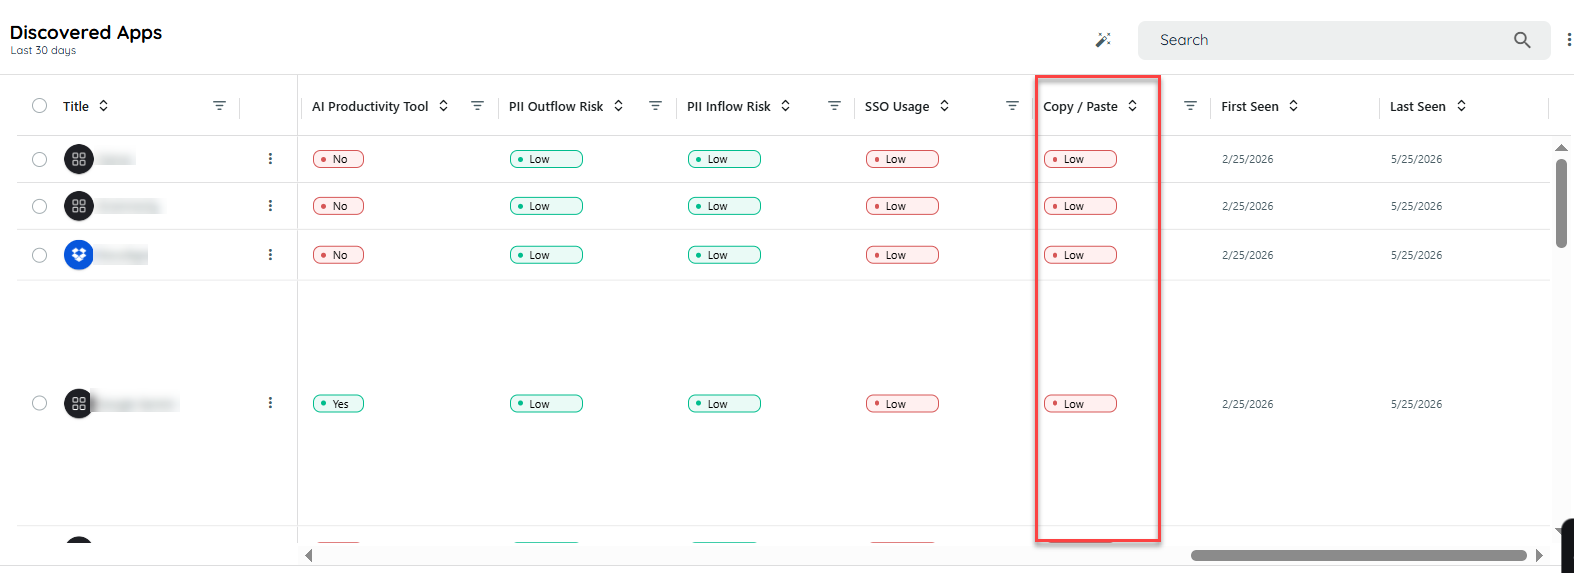
Discovered Apps table showing the Copy/Paste column.
PII Exposure Detection
The PII Exposure Detection feature helps Security and Compliance Administrators identify potential risks related to sensitive information copied to or pasted from monitored applications. The system identifies possible PII elements, including email addresses, phone numbers, and IBANs, during clipboard actions without collecting or transmitting the actual clipboard content.
The feature preserves privacy and is configurable through global or application-level settings in the Discovery module.
The system sends only numerical counts of detected PII items:
- Number of email addresses
- Number of phone numbers
- Number of IBANs
Configurable Controls
Administrators can enable or disable the feature at two levels:
- Global Level Discovery Settings
- Global toggle: Enable PII Data Exposure for Copy and Paste
- Default state: OFF
- Application Level
- Each application inherits the global setting.
- When the global toggle is ON, administrators can enable or disable the feature for each application.
Detection runs only when both the global and application-level toggles are ON.
How PII Detection Works
- Enabling the PII Detector
To activate PII detection, both of the following settings must be enabled:
Global Discovery Setting
The feature must first be turned ON in the main Discovery settings.
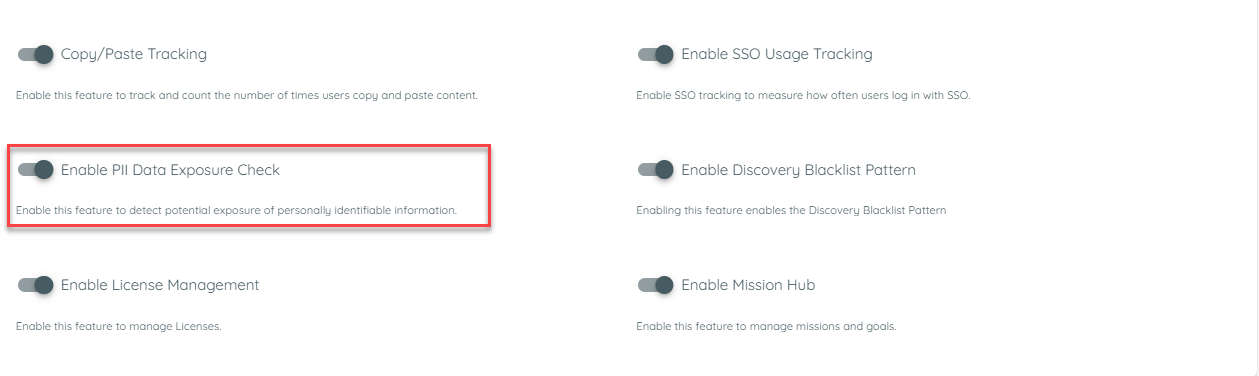
Global Discovery settings with PII Data Exposure Check enabled.
Application Level Setting
After the global toggle is enabled, you must also enable the feature for each specific application.
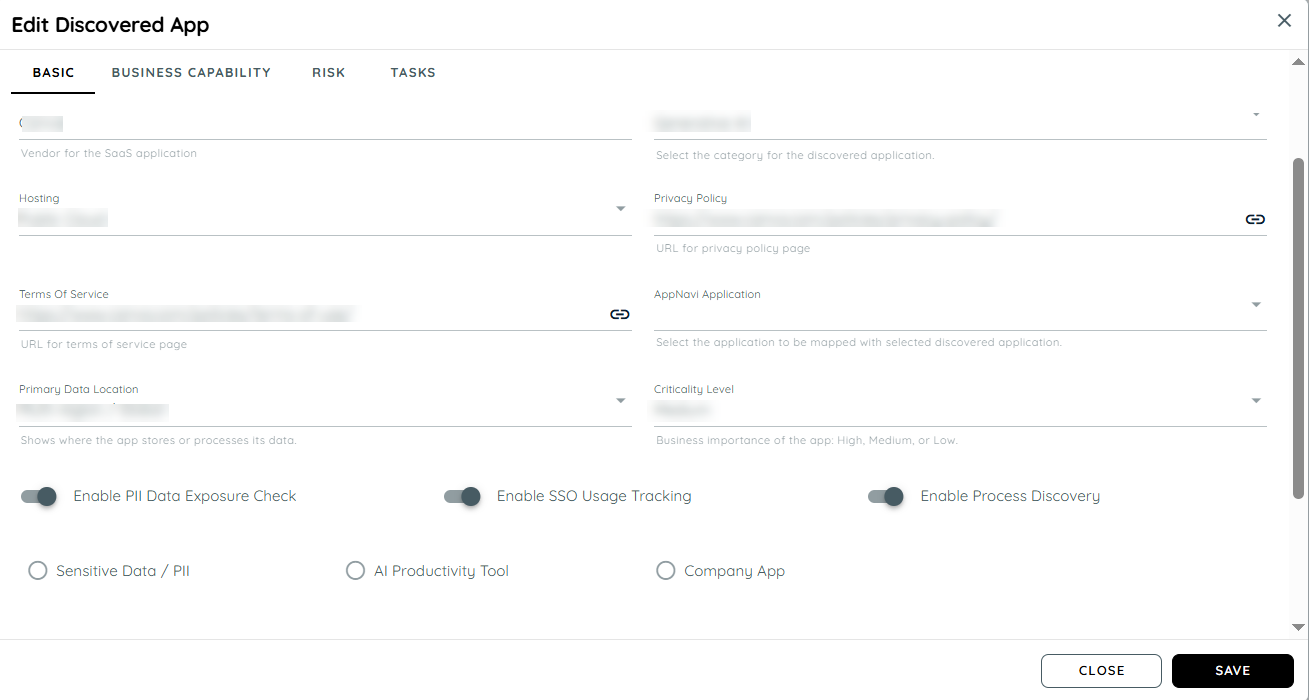
Application-level PII Data Exposure Check setting.
PII detection runs only when both settings are ON.
By default, the PII detector is disabled.
- Detection Behaviour
Once enabled:
- The system monitors copy (outflow) and paste (inflow) actions performed within the discovered application.
- If a user copies or pastes any of the following types of PII:
Email address
Phone number
IBAN
The detector identifies the presence of these PII elements.
- Counting and Displaying Results
- Each time a user copies or pastes PII, the corresponding PII count increases.
- The backend processes these counts to calculate the application's PII exposure level.
- The result is displayed in the Discovery module on the Discovered Apps table in two columns: PII Inflow Risk and PII Outflow Risk. Each column displays High, Medium, or Low based on total detected PII activity.
Users can click a risk badge to view the total detected PII counts for the selected date range.
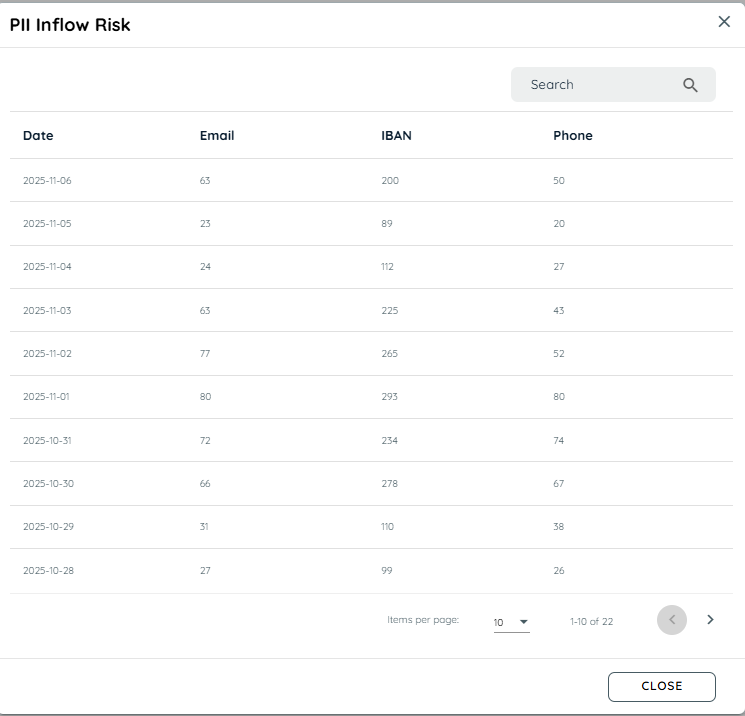
PII Inflow Risk details by date and detected PII type.
How Risk Is Measured
The backend aggregates detection counts to determine the exposure level for each application.
- Raw Weighted Score
Each PII type contributes differently to the overall risk:
PII type weights used in the raw score calculation.
| PII type | Weight |
|---|---|
| 1 | |
| Phone | 2 |
| IBAN | 5 |
Raw score = (Emails x 1) + (Phones x 2) + (IBANs x 5)
- Density per 100 Actions
Risk is normalized based on total clipboard activity:
R100 = (100 x Raw score) / Total actions
- Normalized Score from 0 to 100
The platform converts the density into a normalized risk score based on a reference level. The default reference level is 50.
Score = R100 normalized to a 0 to 100 scale
- Risk Levels Displayed in the Apps Table
Risk levels based on the normalized score.
| Normalized score | Risk level |
|---|---|
| ≥ 50 | High |
| 20–49 | Medium |
| < 20 | Low |
Note: Users can click a risk badge to view the total detected PII counts for the selected date range.
PII Exposure Trend in the App Dashboard
Overview
The PII Exposure Trend feature helps Security and Compliance Administrators track potential sensitive-data exposure over time for each application. It provides a visual summary of inflow (paste) and outflow (copy) risk based on PII detection scores, helping administrators identify patterns and trends in data handling.
Key Features
- PII Exposure Trend Section
- Each application analytics dashboard includes a dedicated section labelled PII Data Flow.
- The section is visible only when PII detection is enabled globally and for the specific application.
- Line Chart Visualization
-
The trend is displayed as a line chart showing normalized PII exposure scores over time.
-
X-axis: Time based on the selected dashboard range
-
Y-axis: Normalized score from 0 to 100
Lines:
-
Inflow Score (paste actions)
-
Outflow Score (copy actions)
- Interactive Tooltips
Hovering over the chart displays detailed information:
- Exact inflow and outflow scores
- Corresponding timestamp
- Behaviour
- The chart adapts to the selected time range on the dashboard.
- If PII detection is turned off globally or for the application, the chart is hidden.
User Segmentation in Discovery
The Discovery dashboard includes three usage-segmentation columns to help users understand how frequently users engage with each application:
- Power Users
- Regular Users
- Occasional Users
These columns appear in the application overview table and provide an at-a-glance view of application adoption patterns across the organization.
What These Segments Mean
Users are grouped based on how often they use an application per week on average during the selected time range.
User segmentation definitions.
| Segment | Meaning |
|---|---|
| Power Users | Users who engage with the application more than 4 days per week on average. |
| Regular Users | Users who engage 2 to 4 days per week on average. |
| Occasional Users | Users who engage less than 2 days per week on average. |
Only users who accessed the application at least once during the selected time range are counted.
Time Range Dependency
User segmentation automatically adjusts to the selected reporting time range. You can select different time periods to see how engagement changes over time.
Minimum supported time range: 30 days
How User Frequency Is Calculated
To keep results consistent across different time ranges, Discovery uses the following approach:
- Counts the number of days a user was active during the selected period.
- Divides that number by the number of weeks in the selected period.
- Rounds the result to the nearest whole number.
- Assigns the user to one of the three segments based on the rounded value.
Examples
- 15 active days in a 30-day range -> 15 / 4 weeks = 3.75 -> 4 -> Regular User
- 22 active days -> 22 / 4 = 5.5 -> 6 -> Power User
- 3 active days -> 3 / 4 = 0.75 -> 1 -> Occasional User
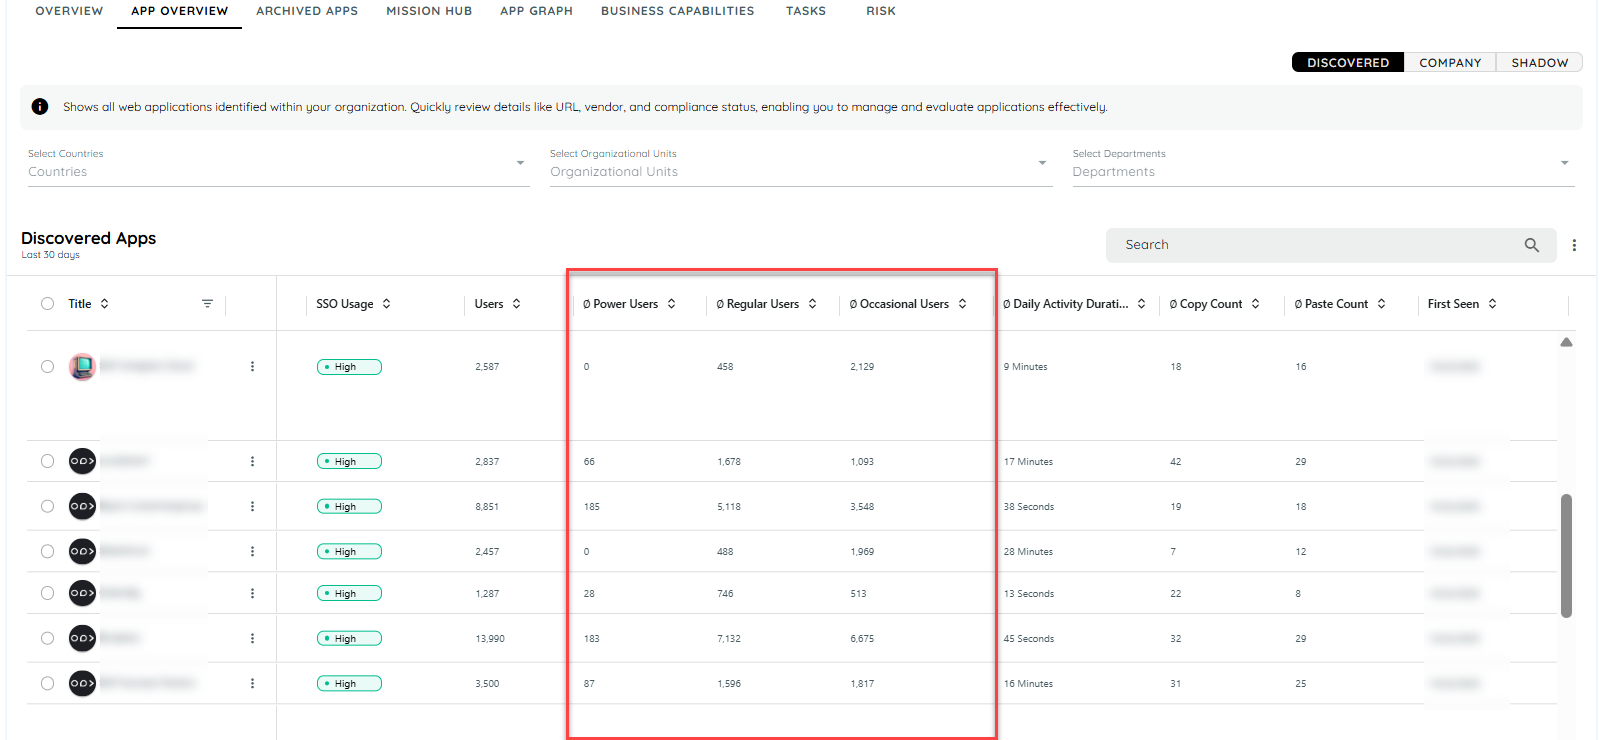
User segmentation columns in the Discovered Apps table.
Business Capability Suggestions
A Business Capability Suggestion is a feature that recommends potential business capabilities for an application based on algorithmic analysis. It provides suggested capabilities with a probability percentage indicating how likely each capability is to apply to the application. Users can review the suggestions and add selected capabilities to the application.
- Each business capability appears only once in the Business Capability Suggestions field in the discovered app edit dialog.
- Each suggestion includes a probability percentage to help users decide which business capability to add.
- Users can select a business capability from the Business Capability Suggestions list.
- A business capability that has already been added does not appear in the suggestions list. If a capability is removed from the app, it appears again if it was previously calculated.
- Business Capability Suggestions are visible only when the Enable Business Capability Tracking setting is enabled in Discovery settings.
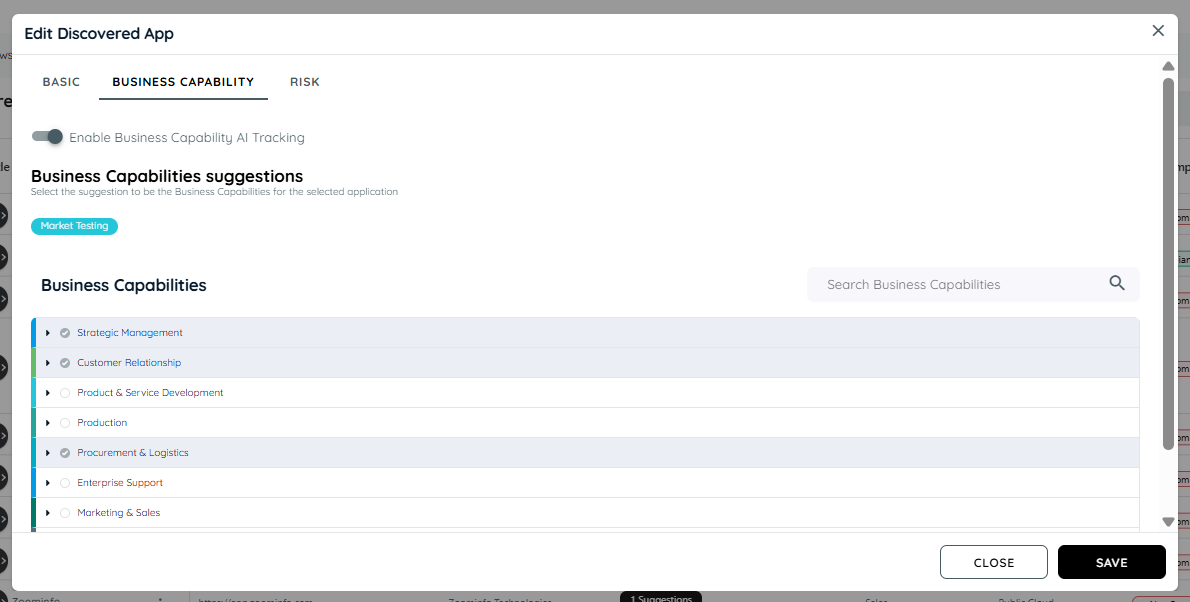
Business Capability Suggestions in the application edit dialog.
Delete Discovery Data
Users can delete all Discovery data by following these steps:
- Navigate to Discovery tab.
- Click on the context menu.
- Click the "Reset" button.
- A confirmation dialog will appear.
- Confirm the action to proceed with deletion.
After confirmation, the system begins deleting the Discovery data. The process may take a few minutes to complete.
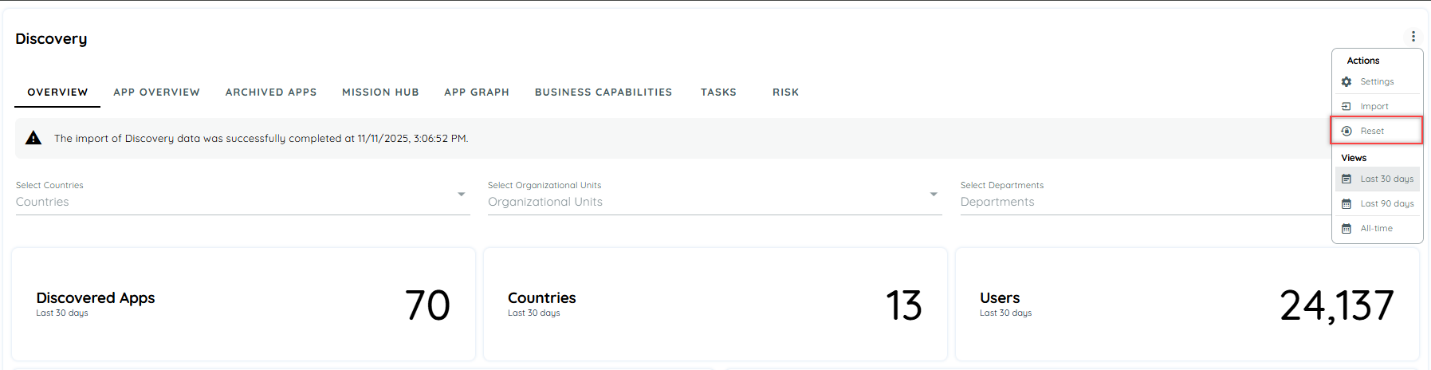
Discovery actions menu with the Reset option.
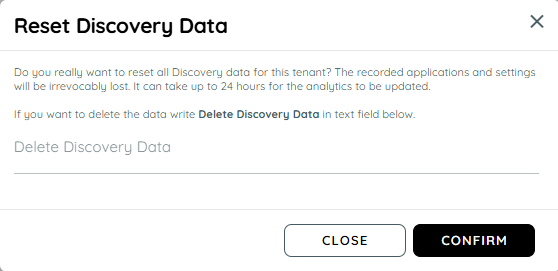
Reset Discovery Data confirmation dialog.
Note: This action permanently removes all existing Discovery data and cannot be undone.
Discovery Recording Filters
Discovery recording events can be controlled by location and organizational unit filters. This allows users to configure recording for specific countries or organizational units.
These settings are available in Discovery Settings.
Steps
- Navigate to Discovery.
- Click the three-dot menu.
- The Discovery Settings dialog appears.
Types of Filters
There are two types of filters that can restrict the recording of Discovery events:
- Country restriction: When enabled, users select the countries where recording is allowed. Events are recorded only in the selected countries. When this filter is disabled, events are recorded in all countries.
- Organizational unit restriction: When enabled, users add patterns that can include wildcards, such as TestFilter*. This pattern matches values such as TestFilter1, TestFilter12, and TestFilter56fh. Events are recorded only when the organizational unit matches one of the configured patterns. When this filter is disabled, events are recorded without an organizational-unit pattern restriction. The same organizational-unit pattern must also be configured in the system registry for the event to be recorded. For more information, see Organizational Unit.
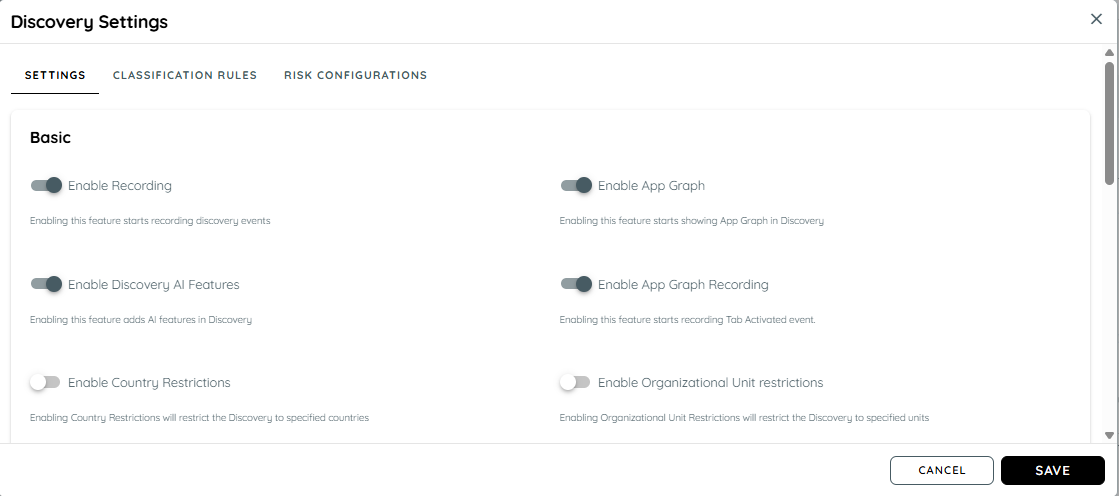
Discovery Settings with country and organizational-unit restrictions.
Updated 21 days ago