Guidance Analytics
The Guidance Analytics Page gives you a complete overview of how users are engaging with your applications and guided content across the organization. It provides insightful data to help you understand:
- How users interact with different applications
- Which content types (like routes, posts, and announcements) are most effective
- Where users are spending the most time
This page is especially helpful for tracking adoption patterns and measuring the overall impact of your guided experiences created through AppNavi.
It contains following:
Overview Analytics
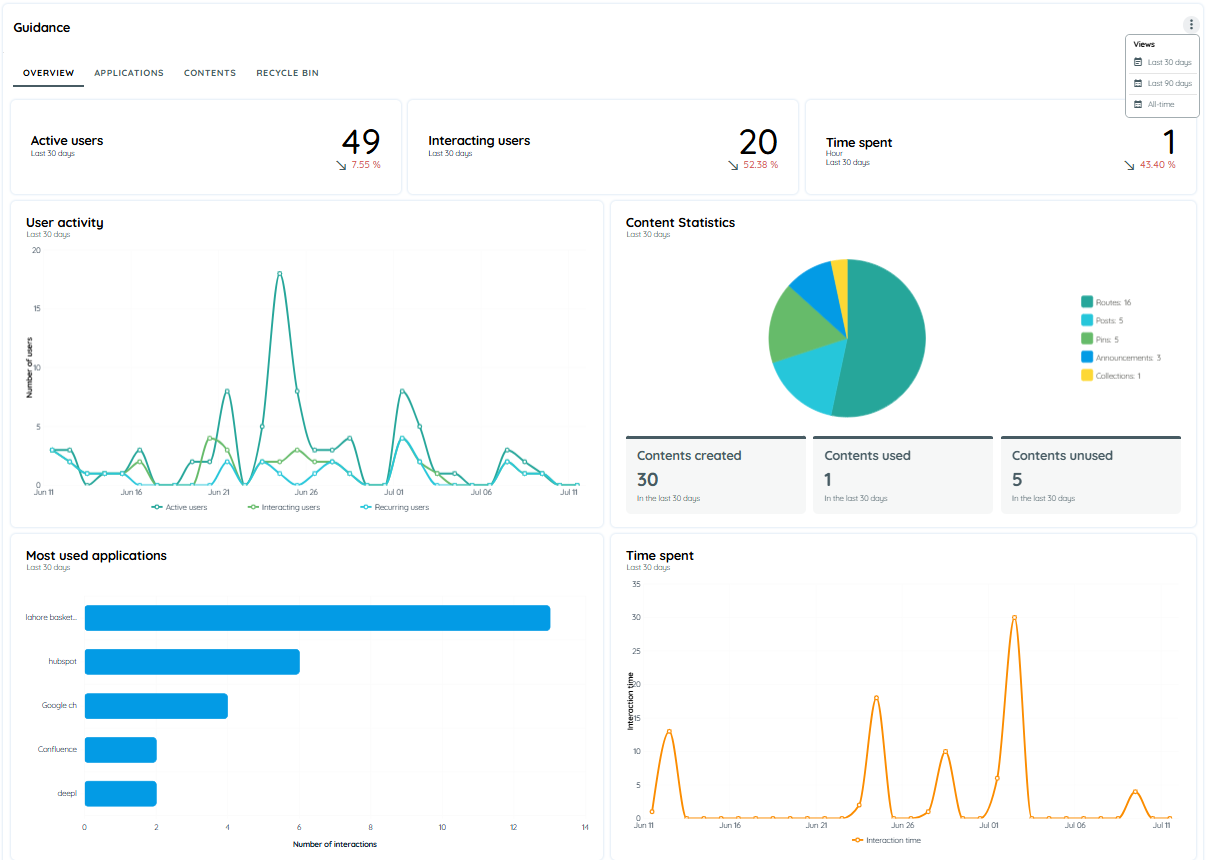
The Guidance Overview Page provides a centralized summary of user engagement and application activity across your organization. It offers powerful analytics to help understand how users interact with applications, which content is most effective, and where time is being spent.
This page is especially useful for monitoring adoption trends and evaluating the impact of guided content provided through AppNavi.
Date Range Filter
The Guidance Overview Page includes a central switch that allows you to filter analytics based on different time ranges. This helps in analyzing trends over specific periods.
Available Time Filters:
- Last 30 Days – View recent activity and short-term user engagement.
- Last 90 Days – Analyze medium-term usage patterns and content performance.
- All Time – Get a complete historical overview of all tracked data since the tenant's activation.
Charts
The Overview page includes the following insights:
User Activity Chart
Displays trends in user engagement across all AppNavi integrated applications. This chart shows how frequently users are interacting with guidance content over time.
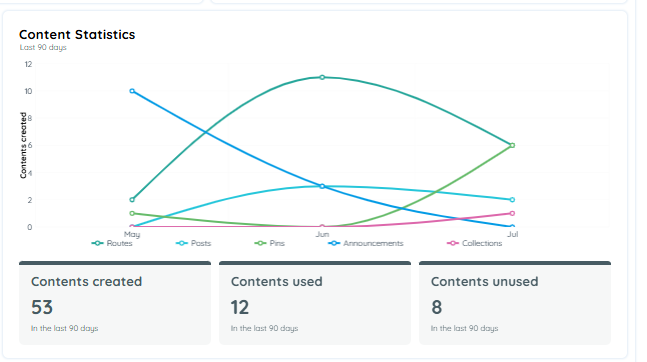
Content Statistics
The Content Statistics section provides a detailed overview of all content types created and used within AppNavi. It helps track content engagement and identify unused content for potential optimization.
This section includes both a line chart and a pie chart for visualizing the data.
Line Chart (on Hover)
When hovering over “Content Created” or “Content Used”, a line chart appears.
This chart shows daily trends, indicating when content was created and when it was actively used by users.
Pie Chart (Default View)
- By default, a pie chart is displayed.
- It shows the distribution of different content types, including:
- Routes
- Announcements
- Pins
- Posts
- Collections
Each segment in the pie chart displays the percentage share and total count of the respective content type, giving a clear snapshot of content usage across the platform.
Line Chart on hover
Most Used Applications
This chart shows a bar chart that displays the number of interactions per application.
It provides a ranking of applications based on user activity, helping users quickly identify which applications are most actively used and engaged with by users.
Time Spent
It is a Line Charts for user activity over time.
It Shows how much time users are spending in different applications, giving you a clearer view of user behavior and software adoption.
Application Analytics
Application Analytics provides insights into how users are interacting with your application, helping you understand engagement, usage trends, and content performance. This guide explains each metric and chart available on the Analytics Dashboard.
The Application Analytics module allows users to view data over different time periods to better understand usage trends and patterns. This is controlled through a central time range switch, located at the top of the analytics dashboard.
Available Time Ranges
Users can choose from the following options:
Last 30 Days: Displays data collected over the past 30 days.
Last 90 Days: Displays data from the last 90 days for broader trend analysis.
All Time: Displays the complete dataset available since analytics tracking began.
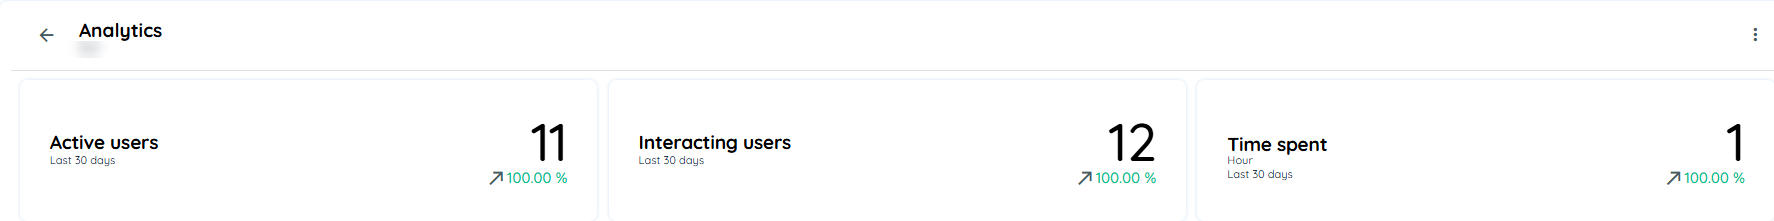
Active Users
Users who click and interact with the avatar (e.g., clicking the avatar) are counted as active users.
Interacting Users
These are users who engage with your content—such as playing a route, clicking a pin, or interacting with posts.
Time Spent
Tracks the total time users spend on the application, helping user to check overall engagement.
Analytics Charts
This is a line chart that illustrates user engagement trends on a daily basis. It tracks the number of:
Active Users – Users who open and interact with the avatar.
Interacting Users – Users who engage with any content such as routes, pins, or posts.
Recurring Users – Users who return and interact with content on multiple days.
By monitoring this chart, user can observe overall activity levels and detect increases or drops in engagement.
Most Used Content
This is a bar chart that highlights the top 5 most frequently interacted-with content items. It could include routes, pins, or posts that have received the highest number of user interactions.
This chart is especially useful for identifying which content resonates most with your users, allowing you to optimize future content based on what works best.
Content Chart
Displayed as a line chart, this visual tracks the daily usage of different content types within the application. It includes:
Started Routes – Number of times users started a guided route.
Started Pins – Number of pins initiated by users.
Displayed Posts – Number of posts viewed by users.
This chart provides insights into content consumption patterns and helps you evaluate how well users guidance and support materials are being utilised.
Time Spent
This line chart shows the total time users spend on the application each day. It captures how long users stay active within the application environment.
By analyzing this chart, user can understand how engaged users are and whether content is holding their attention over time.

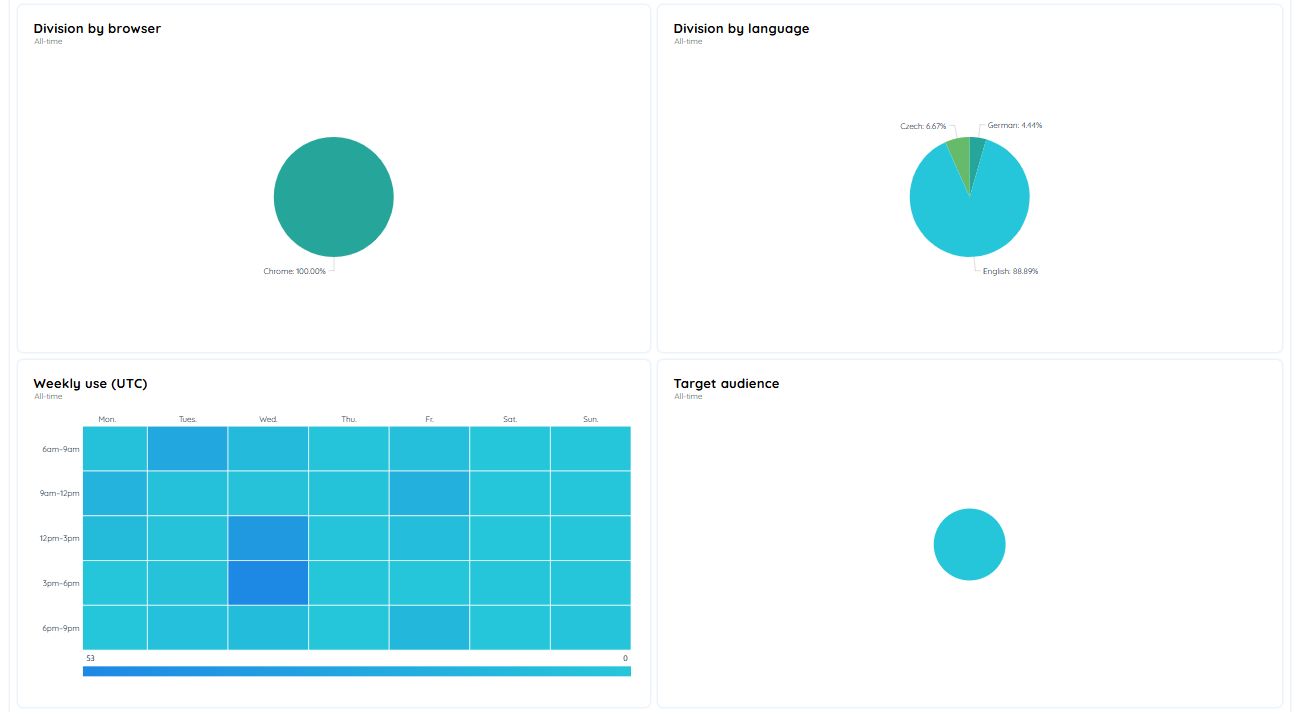
Division by Browser
This chart is displayed as a pie chart and represents the distribution of content usage across different web browsers (such as Chrome, Edge etc.).
It helps you understand which browsers users are most commonly using to access and interact with content, which can be useful for optimization and compatibility decisions.
Division by Language
It is a pie chart, this visualization shows the breakdown of content usage by language. It reflects how many different languages users are viewing or interacting with your content in.
This chart is especially helpful in multilingual environments, allowing you to track content reach and ensure users are supported in their preferred languages.
Weekly Usage Chart
The Weekly Usage Chart provides a visual breakdown of how your content : routes, pins, posts, and announcement is being viewed throughout the week. It helps identify which days and time slots see the most user activity, giving you insight into peak engagement periods.
Weekday Time Slot Tiles
Click on any tile in the grid to see the detailed breakdown of content impressions (routes, pins, posts, or announcements) for that specific time slot and day.
Note: If an application has been disabled or deleted from your tenant/workspace, its usage data will not appear in this chart.
Target Audience
The Target Audience chart is displayed as a bubble chart that visually represents the various target groups user's content is assigned to. Each bubble corresponds to a defined group of users based on specific targeting rules set within your organization.
This chart helps you understand which user segments are being targeted and how much content is directed towards them.
- Target Groups are collections of users defined by rules or filters (e.g., department, location, user role).
- When publishing a route, pin, or post, users can assign it to one or more target groups.
- The size of each bubble reflects the amount of content published for that group.
- For detailed configuration and examples of target groups, please refer to the document Target Audience
User Role Chart
The User Role Chart is a bubble chart that displays how often content (such as routes, pins, or posts) was executed based on the recorded roles of users within the application.
This chart provides insights into which user roles are most actively engaging with content, helping you assess how effectively different roles are being targeted and supported.
It Represents
- Each bubble corresponds to a specific user role (e.g., Admin, Editor, Viewer etc).
- The size of the bubble indicates how frequently content was executed by users with that role.
- This chart appears only if:
- Extended Analytics are enabled in your application.
- The “Record User Role” option is set to true.
- For setup guidance and more details, see the full Record User Role Documentation Role Based
Tables
Interaction objects
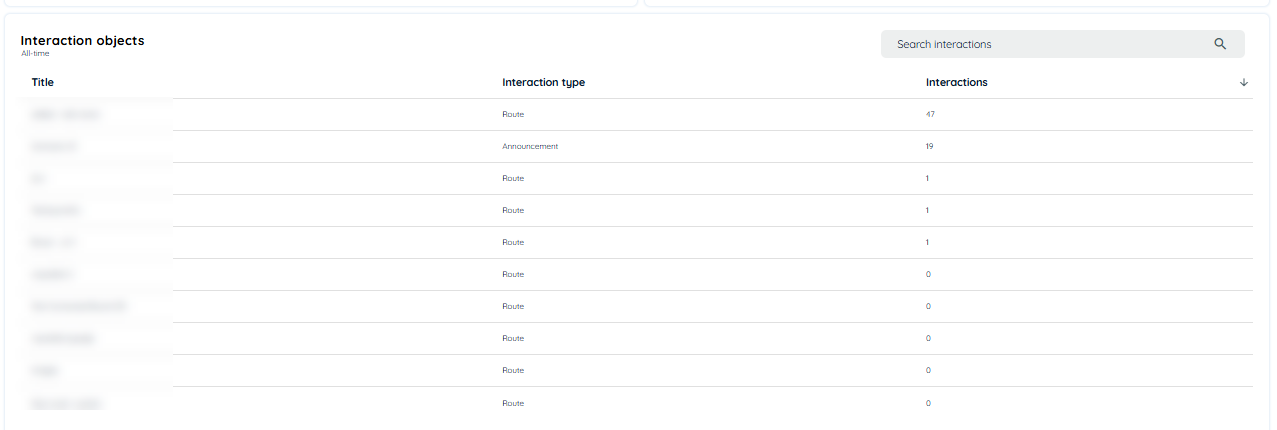
The Interaction Objects Table displays a comprehensive list of all published content items along with their interaction statistics. This table provides users with a quick and accessible overview of how each piece of content is performing based on user engagement.
Content Details
Each row in the table contains the following information:
- Title: The title of the content.
- Interaction Type: Specifies the type of content such as Route, Pin, Post, or Announcement.
- Interactions: Displays the total number of user interactions recorded for that content.
Functionality
Users can click on any content entry in the table to view detailed analytics related to that specific content.
- Upon selection, the user is redirected to the individual content analytics page, where more granular data and charts are available.
- This table acts as a central point for tracking and analyzing content performance, helping users identify which items are engaging users the most.
User search input
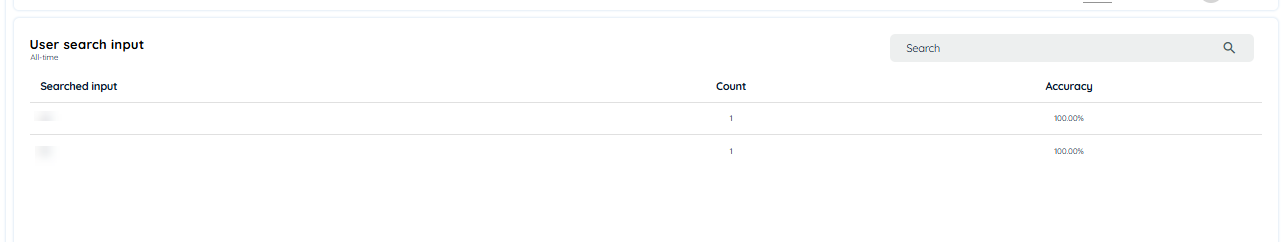
The User Search Input section displays a list of search terms entered by users when looking for content within the application. It provides insights into how users are attempting to find and interact with content via the search functionality.
Content Details
For each search input, the following information is displayed:
- Search Input: The exact term or phrase entered by the user.
- Search Count: The number of times the input was searched.
- Accuracy Percentage: Indicates how accurately the search input matched available content, based on successful interactions after the search.
Content Analytics
Routes
This shows analytics of selected route with time frame of last 30 days, last 90 days and all time, upon selection.
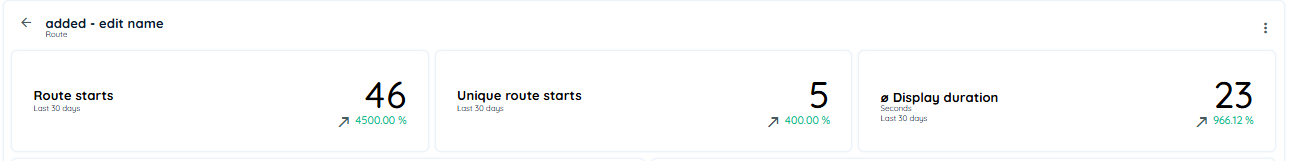
Route starts
This figure shows how often the selected route was displayed and the change in the figure in the selected time frame.
Unique route starts
This figure shows how often the selected route was displayed by different users and the change in the figure in the selected time frame.
Avg. Display Duration
This figure shows how long individual steps of the route were displayed on average and the change of the figure in the selected time frame.
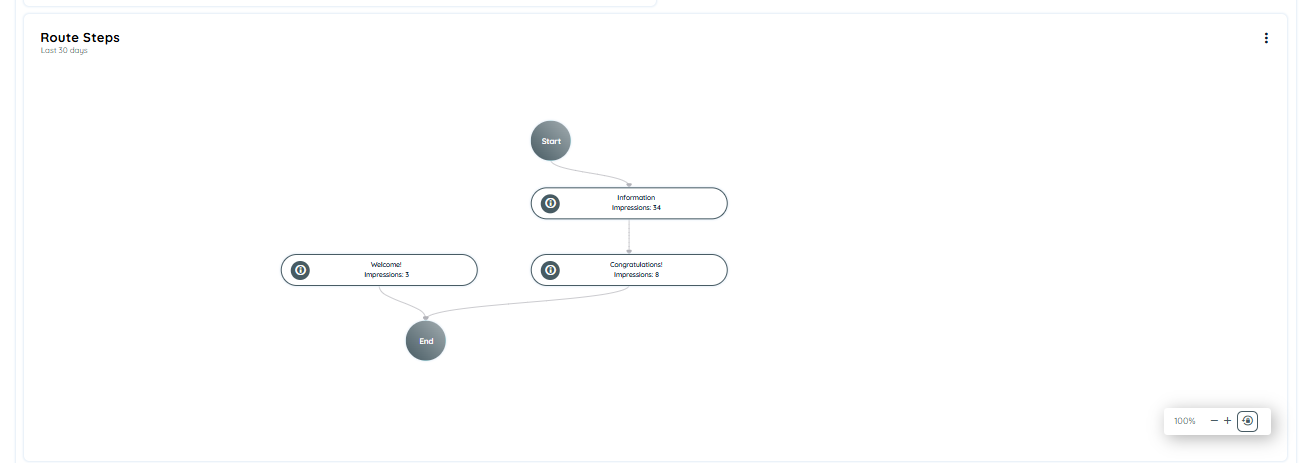
Route Steps
The Route Journey visualization offers a dynamic and insightful representation of how users interact with each step in a Route. Unlike traditional linear progress views, this chart is designed to reflect actual user behavior throughout the journey.
for more details you can read this document Route Steps
Route Steps
Posts
This shows analytics of selected Post with time frame of last 30 days, last 90 days and all time upon selection.
Views
This figure shows how often the selected post was displayed and the change in the figure in the selected time frame.
Unique views
This figure shows how often the selected post was displayed by different users and the change in the figure in the selected time frame.
Avg. Display Duration
This figure shows how long posts were displayed on average and the change in the figure in the selected time frame.

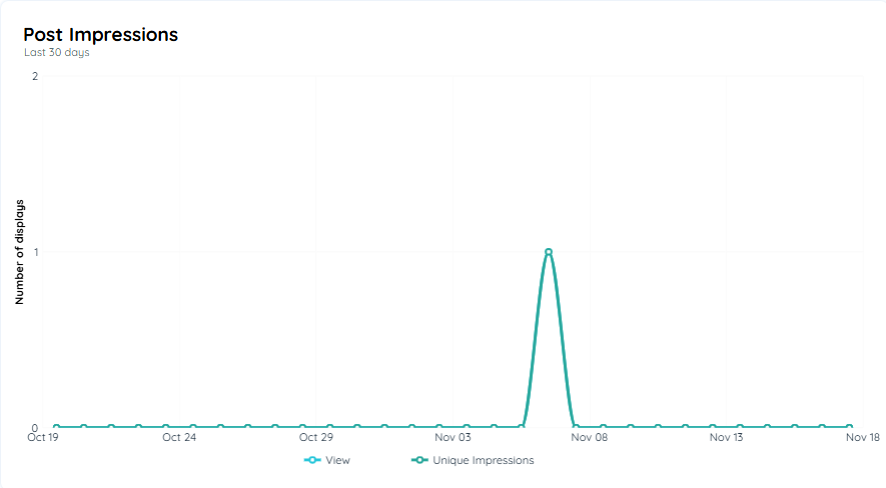
Post Impressions
The Post Impressions Chart is a line chart that visualizes how often posts have been viewed by users over a selected time period. It helps monitor both the reach and visibility of content across your application
Chart Details
This chart includes two distinct data lines:
- Impressions:
Represents the total number of impressions of posts by all users, including multiple views by the same user. - Unique Impressions:
Displays the number of impressions by unique users, ensuring that each user is counted only once per content item
Show/Hide Data Lines:
User can click on the labels in the chart legend to toggle visibility of the Impressions and Unique Impressions lines.
Note: If an application is disabled content / application no longer exists within the tenant or workspace, its data will not be included in the chart results.
User Search Input
The User Search Input table provides insights into how users search for posts within the application. It displays the specific keywords users entered and how frequently those searches occurred.
Table Details
Each entry in the table includes:
Search Input: The exact keyword or phrase used by the user to search for posts.
Search Count: The number of times the specific keyword or phrase was searched.
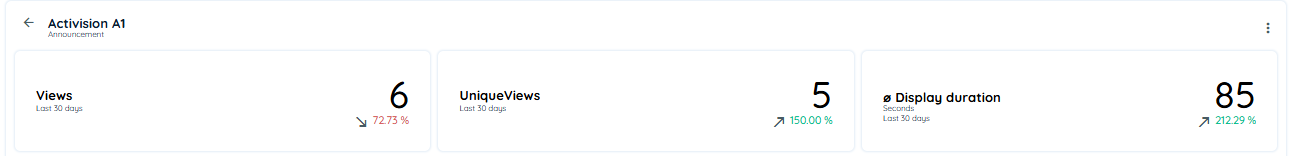
Announcement
This shows analytics of selected Announcement with time frame of last 30 days, last 90 days and all time upon selection.
Views
This figure shows how often the selected announcement was displayed and the change in the figure in the selected time frame.
Unique views
This figure shows how often the selected announcement was displayed by different users and the change in the figure in the selected time frame.
Avg. Display Duration
This figure shows how long announcement were displayed on average and the change in the figure in the selected time frame.
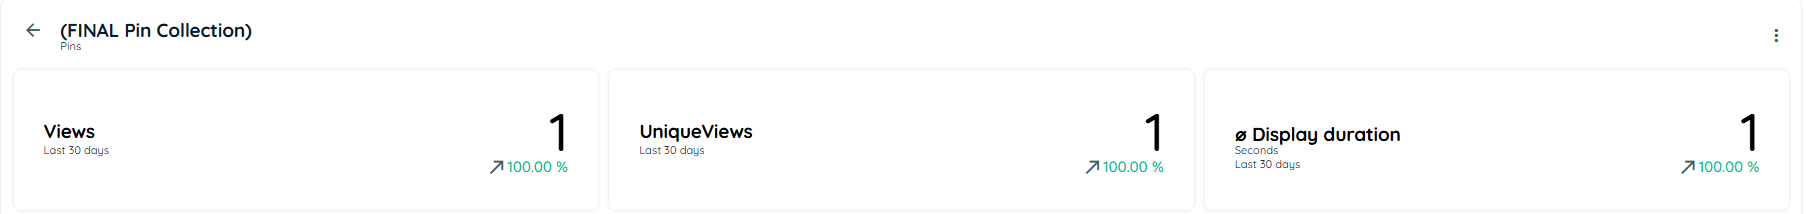
Pins
This shows analytics of selected pins with time frame of last 30 days, last 90 days and all time upon selection.
Views
This figure shows how often the selected pins was displayed and the change in the figure in the selected time frame.
Unique views
This figure shows how often the selected pins was displayed by different users and the change in the figure in the selected time frame.
Avg. Display Duration
This figure shows how long pins were displayed on average and the change in the figure in the selected time frame.
Pins Impressions
The Pins Impressions Chart is a line chart that visualizes how often pins have been viewed by users over a selected time period. It helps monitor both the reach and visibility of content across your application
Chart Details
This chart includes two distinct data lines:
Impressions:
Represents the total number of impressions of pins by all users, including multiple views by the same user.
Unique Impressions:
Displays the number of impressions by unique users, ensuring that each user is counted only once per content item

Updated 8 months ago