
License Management
License Management lets you record what you pay for each application and compare it with how many people actually use it. AppNavi combines your license data with usage from App Discovery to show over-licensed applications and how much you could save by reducing unused licenses.
This page covers what you need before you start, how to add and maintain license data, how to read the dashboard and table, worked analysis examples, and the actions you can take from the license view.
Related pages
• App Discovery: how applications and usage are discovered. License data builds on this.
• Discovery Reports: reports that include license cost and savings findings.
• Discovered Apps Overview: the full list of discovered applications.
OverView
The License feature is part of the Discovery module. It helps you:
• Store license information for each discovered application.
• Create and update license records in bulk with an Excel template, using the App ID as the unique reference.
• Reject invalid or incomplete records during import.
• See eligible users, over-licensed applications and potential savings at a glance.
Demo environments include sample license data so you can explore the dashboard before entering your own.
Opening the License dashboard
- Open Discovery from the left navigation.
- Select the Licenses tab.
The page shows summary cards at the top, two charts in the middle and the License Management table below.
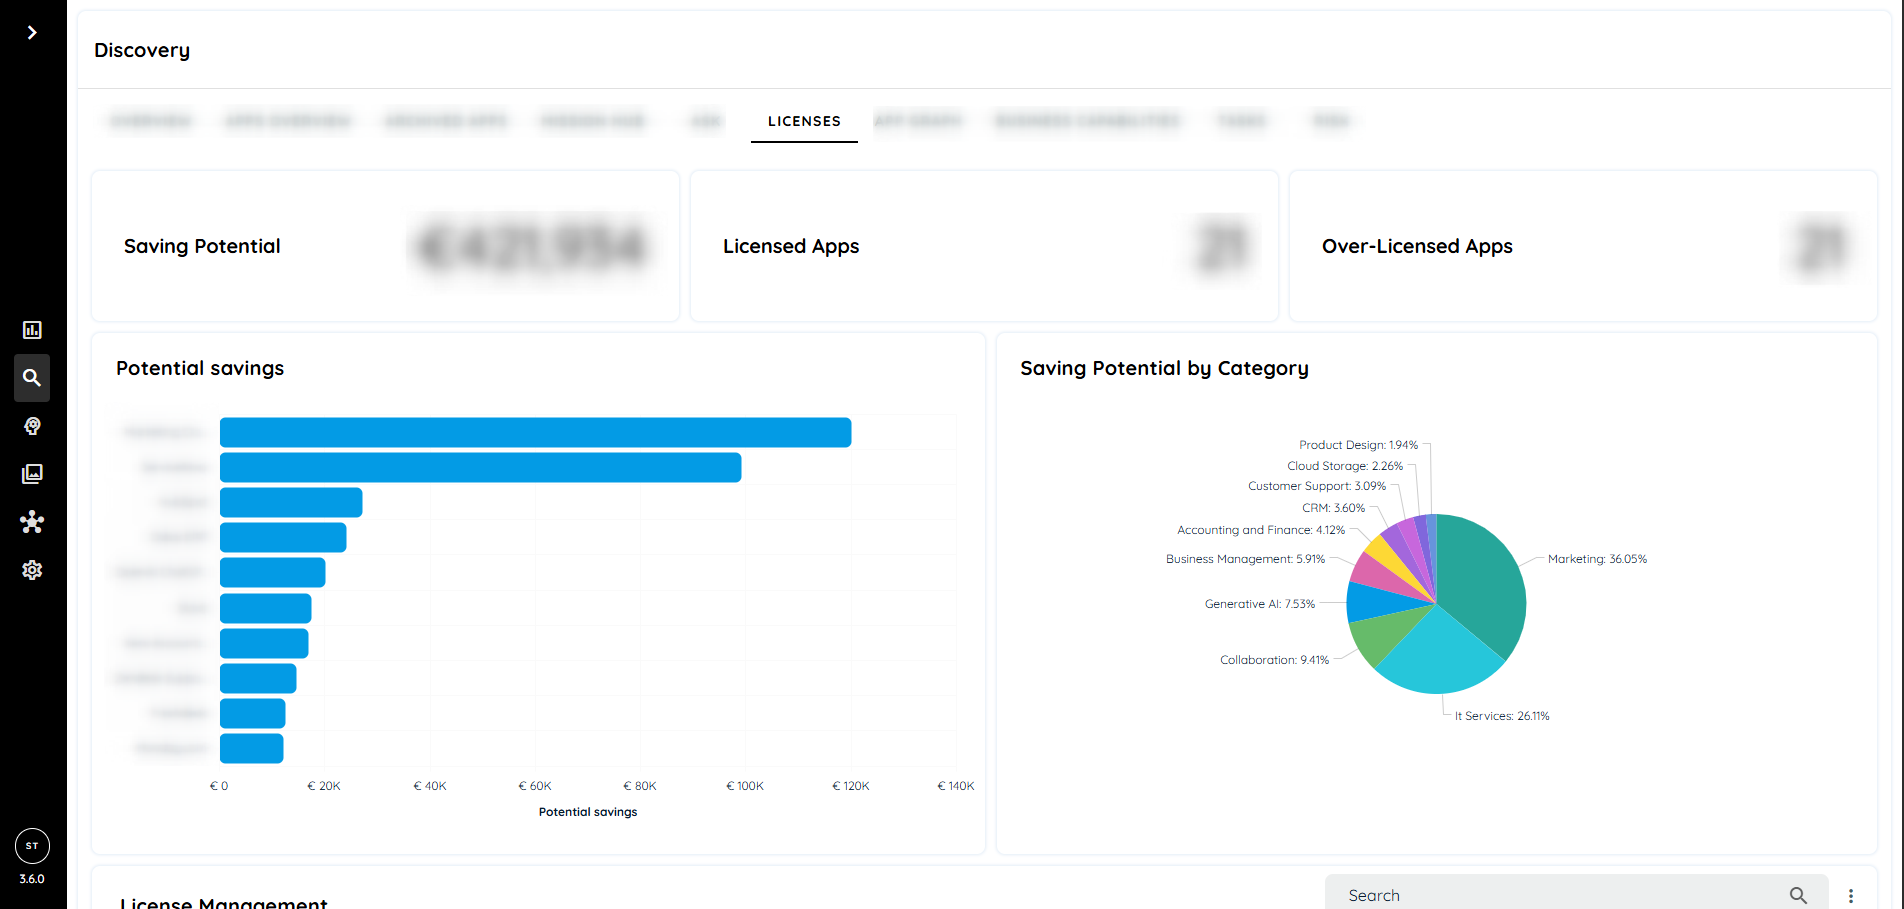
License Dashboard
Dashboard metrics
Summary cards
| Card | What it shows |
|---|---|
| Saving Potential | The total amount you could save by removing excess licenses across all over-licensed applications. |
| Licensed Apps | The number of applications with at least one valid license record. |
| Over-Licensed Apps | The number of applications where purchased licenses exceed eligible users. |

Summary cards at the top of the License dashboard.
Purpose
- The License feature is designed to:
- Manage license information for applications
- Support bulk import through Excel upload
- Update existing license data automatically
- Prevent invalid or incomplete data creation
- Provide visibility into license usage and optimization
- Display insights such as Eligible Users, Over-Licensed Applications, and Potential Savings
Steps License Dashboard
- Navigate to Discovery.
- Open the License tab.
- The License Dashboard will appear.
The dashboard displays license-related metrics and visual insights.
Potential savings chart
This bar chart ranks applications by their individual savings, largest first. Use it to see which few applications account for most of the Saving Potential.
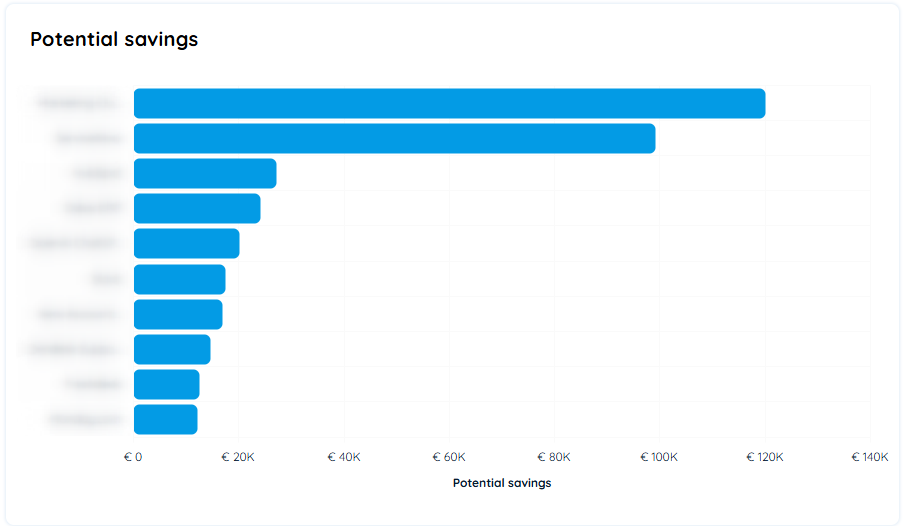
Potential savings per application, largest first.
Saving Potential by Category chart
This pie chart groups savings by application category, such as Marketing, IT Services or Collaboration. Use it to see which business areas to review first. In Figure 1, Marketing (36.05%) and IT Services (26.11%) account for more than 60% of the total.
License Management Table
The License Management table displays application-level license data. Each row represents one application.
Below is a detailed explanation of each column.
| Column | Description | Editable |
|---|---|---|
| App Name | The application name. | No |
| Application URL | The application URL. | No |
| Category | The application category, used for grouping and the category chart. | No |
| Savings | Automatically calculated when licenses exceed eligible users. | No |
| Eligible Users | The number of active or eligible users. Auto-calculated from usage data. | No |
| Licenses | The total number of purchased licenses. | Yes or updated via Excel import. |
| Price Per Seat | The cost of one license. Used for cost calculation. | Yes |
| Total Cost | The total license cost. Automatically calculated: License × Per Seat | No |
How values are calculated
• Total Cost = Licenses × Price Per Seat
• Savings = max(Licenses − Eligible Users, 0) × Price Per Seat
• Over-licensed means Licenses is greater than Eligible Users.
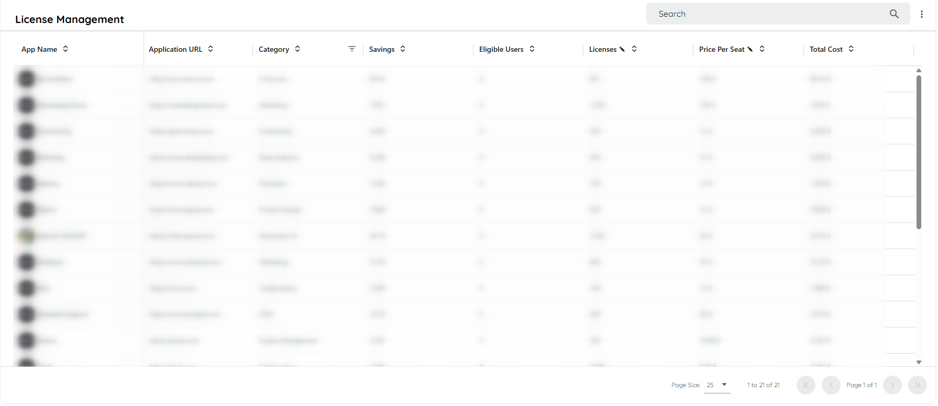
The License Management table.
Edit a single application
- Find the application using the search box.
- Select the Licenses or Price Per Seat cell and enter the new value.
- Confirm the change. Total Cost and Savings update for that row, and the dashboard reflects the change.
License Table – More Options Menu
The three-dot button is available on the License page to provide additional actions.
| Action | What it does |
|---|---|
| Refresh | Reloads the table and updates the dashboard with the latest data. |
| Import | Uploads an Excel file to create or update license records in bulk. |
| Download | Downloads the current license data as an Excel file. |
| Template | Downloads the Excel template in the License table format. Use this template for imports. |
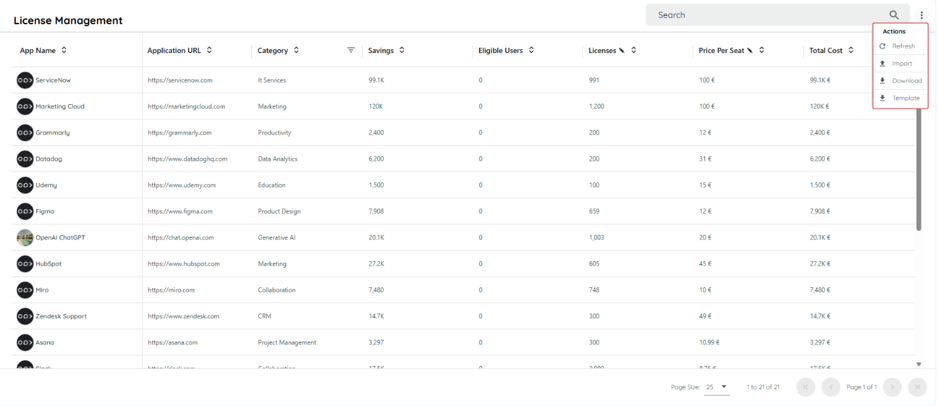
The Actions menu with Refresh, Import, Download and Template.
Import license data in bulk
-
Open the three-dot menu above the table and select Template to download the Excel template.
-
Open the three-dot menu again and select Import, then choose your file and click on the import button
-
Review the result. Existing records are updated, new records are created, and rows with missing or invalid values are not imported.
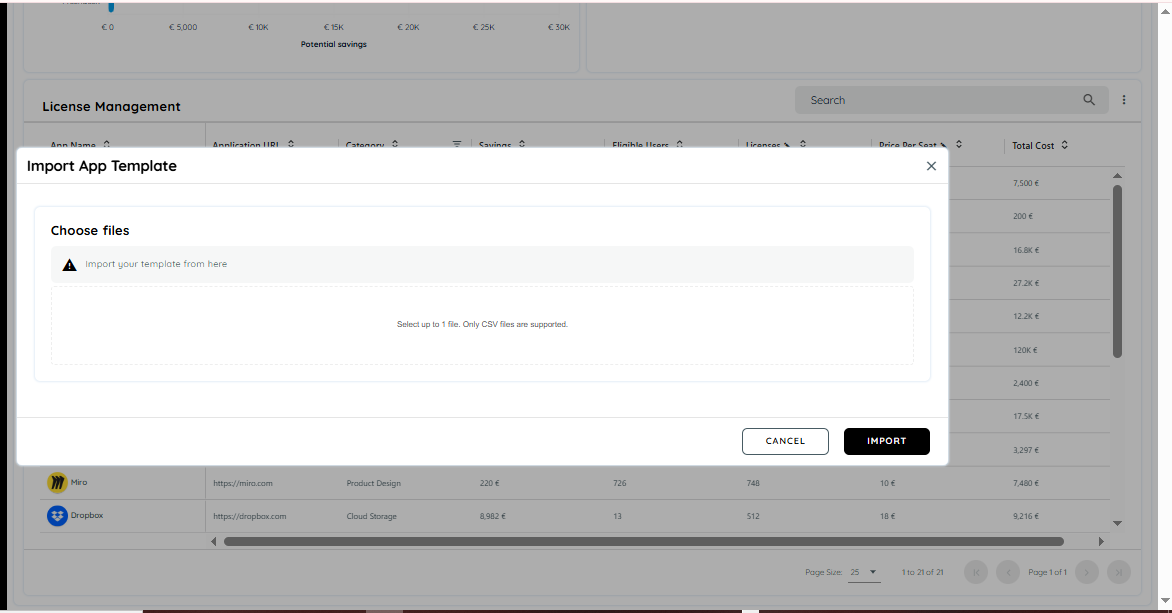
The Import App Template dialog. Upload the CSV file
-
Select Refresh if the dashboard does not show the new values yet.
Tip: To update existing data, select Download first. This gives you the current data in Excel, which you can edit and import again.
Example analyses
Example 1: Calculate savings for one application
Zoom has 120 eligible users. You enter 200 licenses at €15 per seat.
| Step | Calculation | Result |
|---|---|---|
| Excess licenses | 200 − 120 | 80 |
| Savings | 80 × €15 | €1,200 |
| Total cost | 200 × €15 | €3,000 |
On the dashboard, Zoom is counted as an Over-Licensed App, €1,200 is added to Saving Potential, Zoom appears in the Potential savings chart if it ranks in the top entries, and its category share in the pie chart increases.
Updated 15 days ago