
Automation Opportunities
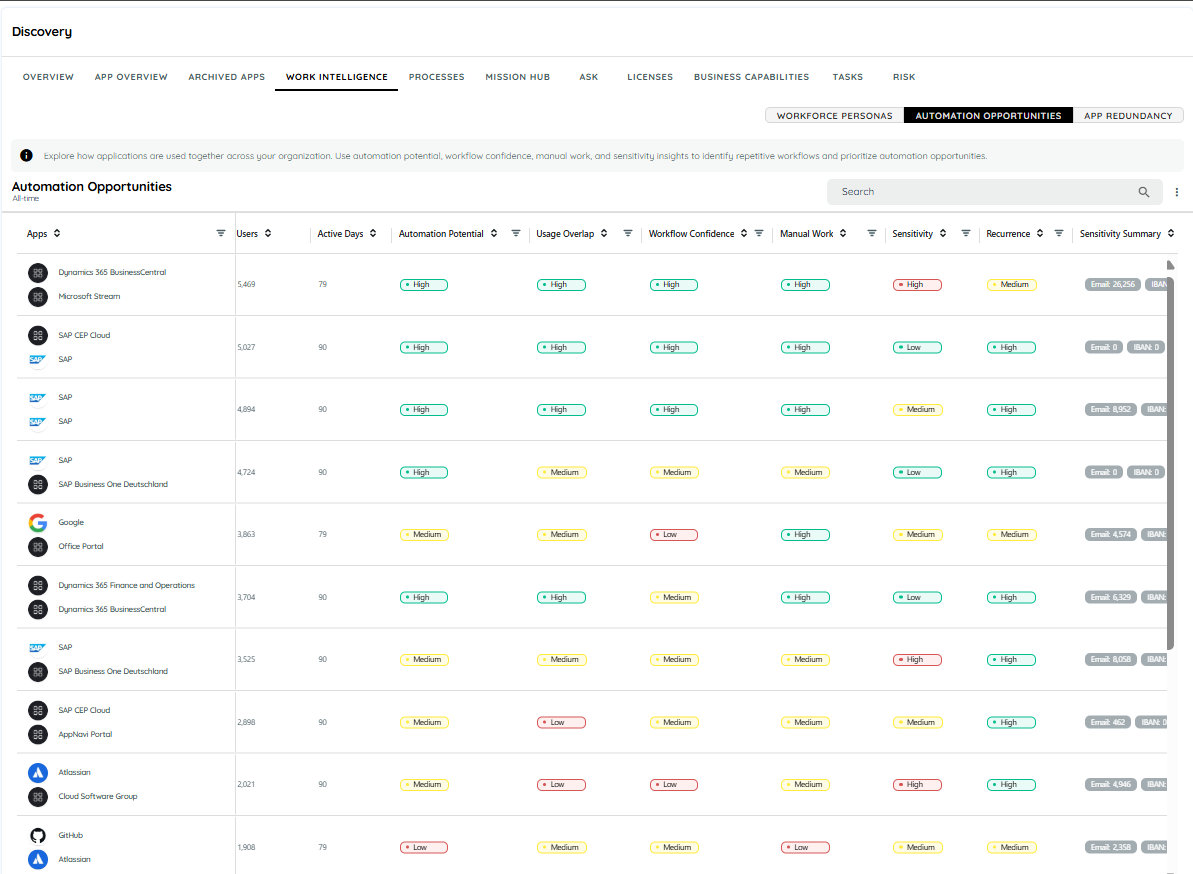
The Automation Opportunities feature helps organizations identify application pairs that are frequently used together and may represent opportunities for process automation. It analyzes application usage patterns across users and active days and provides insights into automation potential, workflow confidence, manual work, data sensitivity, and recurrence.
By combining these indicators, users can identify repetitive cross-application workflows, understand how consistently the applications are used together, and prioritize workflows that may benefit from automation.
Access Automation Opportunities
To access Automation Opportunities:
- Navigate to Work Intelligence from the AppNavi Portal.
- Select the Automation Opportunities tab.
- The Automation Opportunities table displays application pairs identified from organizational usage data.
- Use the available filters, search, and sorting options to analyze specific opportunities.
The Automation Opportunities view provides a consolidated view of application pairs and their associated usage and workflow indicators.
Automation Opportunities Overview
The Automation Opportunities table provides insights into how applications are used together across the organization.
Each row represents an application pair and contains the following information:
Apps: The two applications identified as being used together.
Users: Number of users associated with the application pair.
Active Days: Number of days on which the application pair was actively used.
Automation Potential: Indicates how suitable the observed usage pattern may be for automation.
Usage Overlap: Indicates how strongly the two applications are used together.
Workflow Confidence: Indicates how consistently the observed application relationship forms a recognizable workflow.
Manual Work: Indicates the level of manual interaction involved in transferring or handling information between the applications.
Sensitivity: Indicates the level of potentially sensitive data involved in the observed workflow.
Recurrence: Indicates how repeatedly the workflow pattern occurs.
Sensitivity Summary: Provides additional information about detected sensitive data categories and their counts.
Application Pair
Each row represents two applications that demonstrate a measurable relationship in organizational usage.
For example:
Dynamics 365 Business Central → Microsoft Stream
The application pair does not necessarily mean that one application technically integrates with the other. Instead, it represents an observed usage relationship between the two applications.
The pair is derived from application activity observed across users and time.
This distinction is important because an Automation Opportunity identifies a potential workflow pattern, rather than confirming that an existing API or integration exists between the applications.
Users
The Users column displays the number of users associated with the application pair during the selected reporting period.
A higher number of users indicates that the observed application relationship occurs across a broader user population.
This can help organizations identify workflows that may have a larger potential business impact.
For example:
100 users → workflow is observed across a relatively small user group.
1,000+ users → workflow may represent a broader organizational opportunity.
Active Days
The Active Days value represents the number of days on which activity associated with the application pair was observed.
A higher number of active days indicates that the application relationship persists over a longer period rather than appearing as an isolated event.
For example:
90 Active Days
indicates that the application pair was observed during the complete reporting period represented by the data.
Automation Potential
Automation Potential indicates how suitable an application pair may be for automation based on the observed usage pattern.
The score considers signals such as repeated application usage, user coverage, and recurring activity.
The result is presented using three levels:
| Level | Meaning |
|---|---|
| High | Strong evidence that the application pair represents a potentially automatable workflow. |
| Medium | Some evidence of automation potential, but additional analysis may be required. |
| Low | Limited evidence that the observed application relationship represents a suitable automation opportunity. |
A high Automation Potential score should therefore be interpreted as a prioritization signal, not as confirmation that automation can definitely be implemented.
Usage Overlap
Usage Overlap indicates how strongly the two applications are used by the same users and within related activity patterns.
A high overlap suggests that the applications frequently appear together within the observed usage data.
For example:
High Usage Overlap
indicates that a substantial portion of the users interacting with one application also interact with the other.
A lower score indicates that the applications have less consistent overlap.
Workflow Confidence
Workflow Confidence measures how clearly the observed application relationship resembles a repeatable workflow.
It considers factors such as:
Repeated application pairing
Consistency of usage
Directionality between applications
Activity across users
Recurrence over time
The result is categorized as:
| Level | Meaning |
|---|---|
| High | The application relationship shows a clear and repeatable workflow pattern. |
| Medium | A workflow pattern is visible, but the relationship is less consistent. |
| Low | The application relationship is weak or inconsistent. |
Example
A pair with:
Workflow Confidence = High
suggests that the applications repeatedly appear together in a recognizable sequence or usage pattern.
This does not necessarily mean that one application always directly triggers the other.
Manual Work
The Manual Work indicator represents the amount of manual interaction associated with the observed workflow.
This metric is particularly useful for identifying workflows where users repeatedly move or handle information between applications.
Signals may include clipboard activity such as:
Copying information
Pasting information
Repeated transfer of content between applications
The result is categorized as:
| Level | Meaning |
|---|---|
| High | Strong evidence of manual interaction or information transfer. |
| Medium | Moderate manual interaction is observed. |
| Low | Limited manual interaction is observed. |
A high Manual Work score combined with high Recurrence can represent an especially interesting automation candidate.
Sensitivity
The Sensitivity indicator represents the potential sensitivity of information involved in the observed workflow.
The analysis can identify categories such as:
Email addresses
Phone numbers
IBANs
The system uses the presence and volume of detected sensitive-data activity to determine the sensitivity level.
The available levels are:
| Level | Meaning |
|---|---|
| High | Significant sensitive-data activity is associated with the workflow. |
| Medium | Some sensitive-data activity is observed. |
| Low | Little or no sensitive-data activity is observed. |
The sensitivity score should be considered alongside the automation potential when prioritizing opportunities.
Sensitivity Summary
The Sensitivity Summary provides more detail about the sensitive information detected for an application pair.
For example, the table may display indicators such as:
Email: 26,256
IBAN: 0
Phone: X
These values represent detected activity counts rather than the actual sensitive information.
The feature is designed to provide visibility into potential data exposure while avoiding the storage or display of the underlying sensitive content.
Recurrence
Recurrence indicates how repeatedly the application pair appears in the observed usage data.
A high recurrence indicates that the same application relationship occurs repeatedly across users or days.
The levels are:
| Level | Meaning |
|---|---|
| High | The workflow pattern occurs frequently and consistently. |
| Medium | The pattern occurs periodically. |
| Low | The pattern occurs infrequently. |
Automation Opportunity Details
Selecting an application pair opens a detailed view of the identified automation opportunity. The page provides an overview of the applications involved, user and activity information, and key indicators such as Automation Potential, Workflow Confidence, Manual Work, and Data Sensitivity.
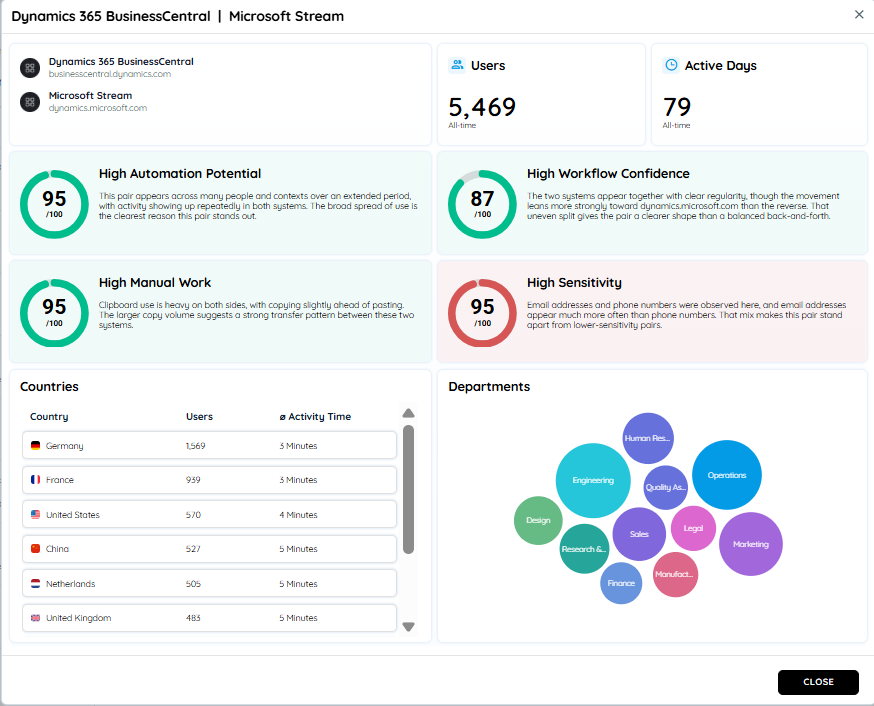
The page also provides a breakdown of the affected countries and departments, helping users understand where the workflow occurs and which business areas are involved. This detailed context helps users assess the opportunity and determine whether the workflow is a suitable candidate for automation.
Updated about 1 month ago