
App Redundancy
App Redundancy
App Redundancy helps you see where applications may do similar work, which application is the main one in each group, and what should be checked before any change is made.
App redundancy occurs when multiple applications are being used for similar purposes, and one application may potentially replace or reduce the need for another.
Primary and Redundant Applications
App Redundancy compares applications to identify potential overlap and determine whether applications may be performing similar business functions.
Primary Application
The Primary Application is the application selected as the main application for comparison within an app group. It is used as the reference point when evaluating user overlap, capabilities, usage, and other comparison metrics.
Redundant Application
A Redundant Application is an application that has significant overlap with the primary application and may provide similar functionality or serve similar business needs.
Being identified as a redundant application does not automatically mean that it should be removed. The application should be validated against business requirements, users, unique capabilities, integrations, security requirements, cost, and other organizational needs before any decision is made.
Example
Suppose an organization uses:
- Microsoft Teams for communication and collaboration
- Slack for communication and collaboration
If the same users are using both applications for similar activities, there is an application overlap. App Redundancy can identify one application as the Primary Application and the other as a potential Redundant Application for further evaluation.
How Does App Redundancy Work?
AppNavi's App Redundancy analysis can identify this overlap by looking at things such as:
- User Overlap : How many users use both applications?
- Capability Overlap : How much functionality do the applications have in common?
- Usage : How frequently are the applications being used?
- Unique Capabilities : What functionality exists only in the candidate application?
- Usage Trends : Is usage of one application increasing or decreasing?
Based on these factors, App Redundancy highlights applications that may have a high level of overlap.
What Is Application Overlap?
Application overlap means that two applications provide similar functionality or are used for similar business activities.
For example, an organization may use two different applications for managing customer relationships. If many of the same users use both applications and they provide similar capabilities, these applications may have a high level of overlap.
This does not automatically mean that one application should be removed. It simply highlights an area that may need further evaluation.
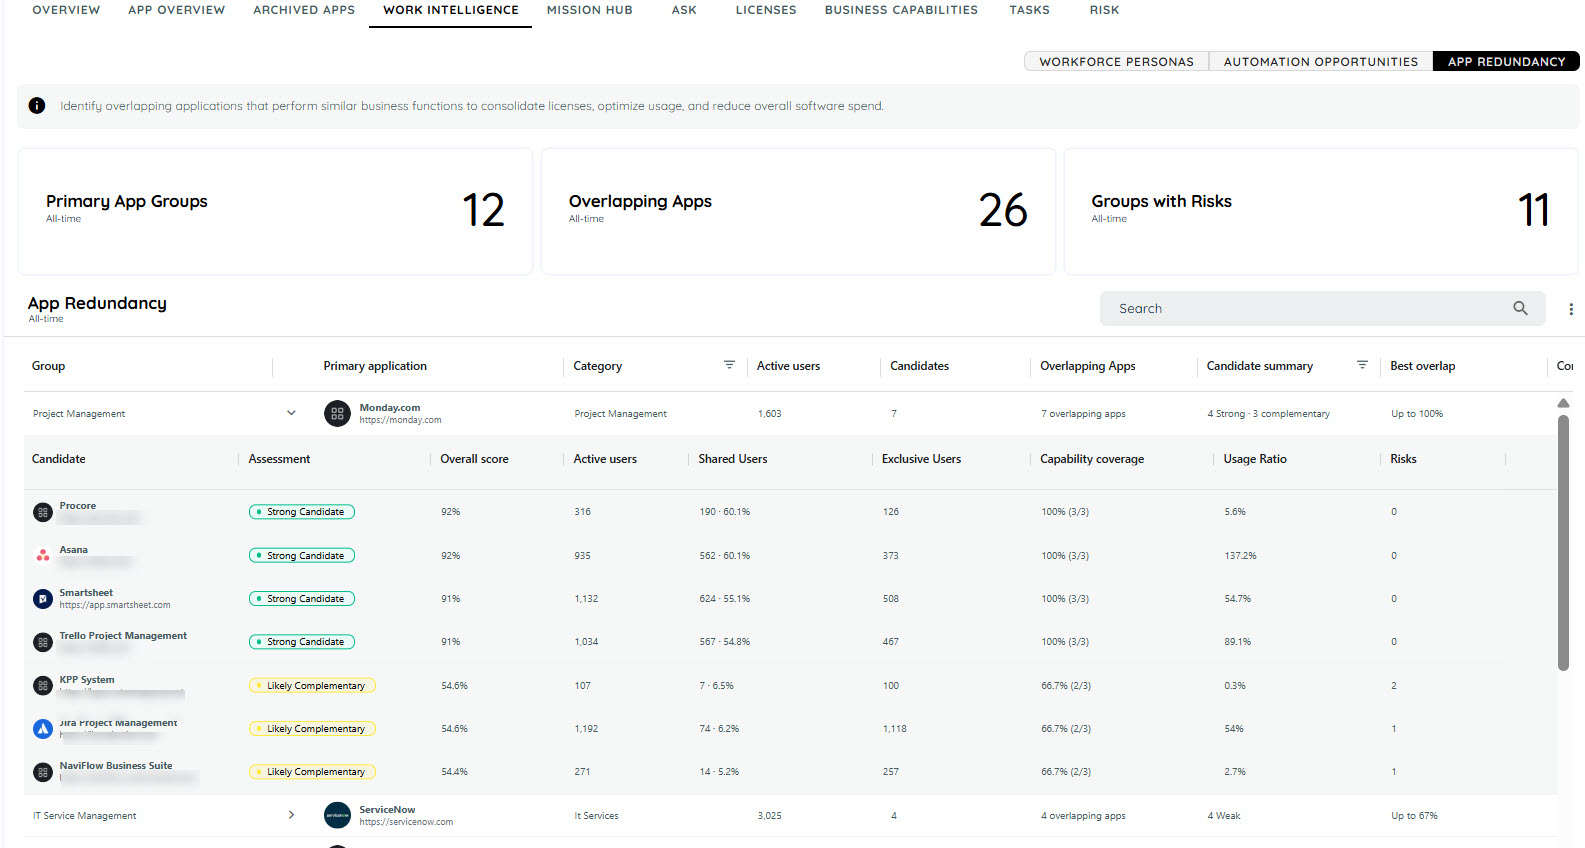
App Redundancy
Understanding the Results
App Redundancy groups applications based on the level of overlap.
Strong Candidate
Applications in this category have a high level of overlap.
They have significant similarities in their capabilities and are often used by the same users.
These applications may be good candidates for further evaluation to determine whether both applications are needed.
Weak Candidate
Applications in this category have some level of overlap, but the overlap is not strong enough to indicate clear redundancy.
The applications may share some capabilities or users while still serving different needs.
These applications may require further investigation.
Likely Complementary
Applications in this category have limited overlap.
They may be used by some of the same users, but they generally provide different capabilities or support different business needs.
These applications are more likely to complement each other rather than duplicate each other.
App Redundancy Decision Workflow
Use the following workflow before making changes based on App Redundancy results.
- Validate the Finding
Review the primary and potential redundant applications and validate the overlap using:
- User overlap
- Capability overlap
- Usage
- Unique capabilities
- Usage trends
- Geography and department information
- Identified risks and deviations
Confirm that the identified overlap reflects an actual business scenario and is not caused by incomplete or misleading usage data.
- Evaluate Business Requirements
Before assigning an application for remediation, review:
- Business requirements
- User needs
- Application integrations
- Security and compliance requirements
- Application costs
- Unique capabilities
- Department or regional requirements
A high overlap score alone should not be treated as a removal decision.
- Assign an Action
After validation, assign an appropriate action for the application.
Possible actions include:
- Retain both applications when they serve different business needs.
- Investigate further when the available evidence is not sufficient.
- Consolidate applications when the organization confirms that both applications are not required.
- Remediate the redundant application when a business decision has been made to reduce or remove its usage.
- Remediate
Carry out the agreed action based on the business decision.
For example:
- Reduce duplicate application usage.
- Migrate users to the primary application.
- Replace or retire the redundant application.
- Update application ownership or assignment.
- Communicate the change to affected users and departments.
-
Review the Result
After remediation, review application usage and overlap again to confirm that the expected change has occurred.
Continue monitoring the applications where required to ensure that duplicate usage does not return.
Key Metrics
App Redundancy uses several metrics to help understand the relationship between applications.
User Overlap
Shows how many users are using both applications.
A higher user overlap means that more users are working with both applications.
Capability Overlap
Shows how many capabilities are shared between the applications.
A higher capability overlap means that the applications provide more similar functionality.
Higher Usage Than Primary
Shows whether the candidate application is being used more than the primary application.
This can help identify applications that may have a significant role in users' daily work.
Unique Capabilities
Shows capabilities that are available in one application but not the other.
These unique capabilities are important when evaluating whether applications can actually replace one another.
Usage Trend
Shows how application usage changes over time.
This can help you understand whether an application is becoming more or less important to users.
Primary and Candidate Applications
App Redundancy compares applications using two terms:
Primary Application
The application selected as the main application for comparison.
Candidate Application
The application being compared with the primary application to determine how much their usage and capabilities overlap.
For example:
Primary: Microsoft Teams
Candidate: Slack
The analysis then evaluates how much Teams and Slack overlap in terms of users, capabilities, and usage.
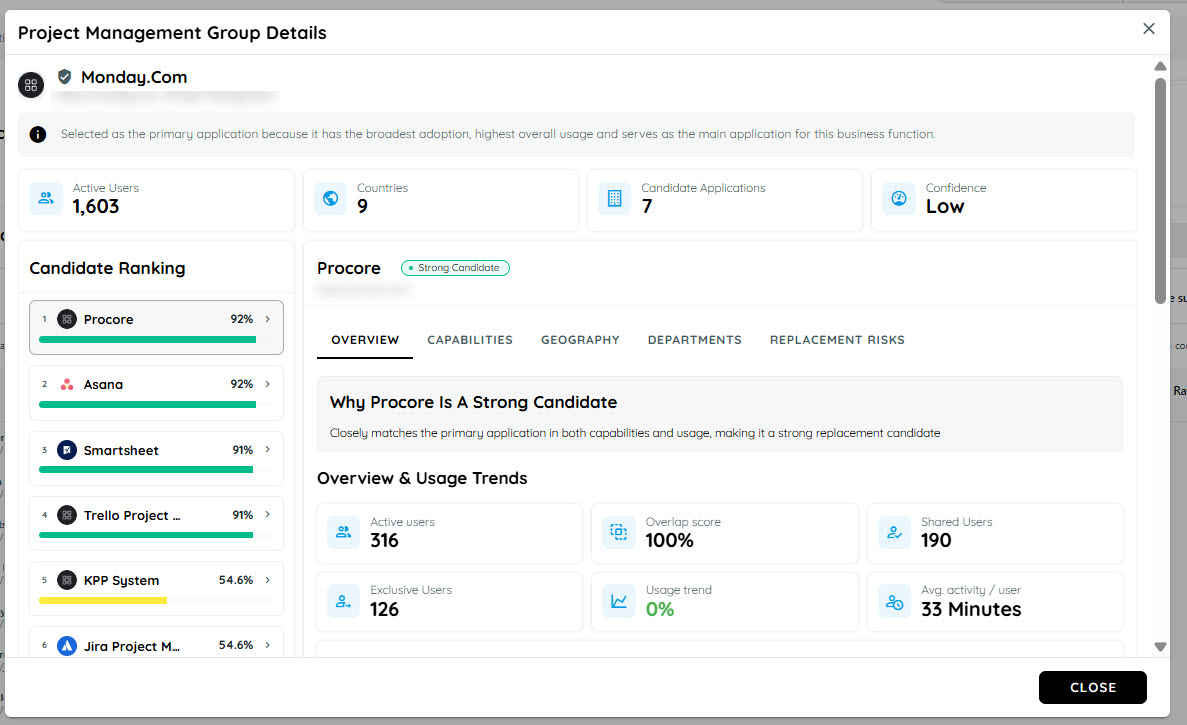
Group Details
Dashboard summary cards
| Values | Explanation | Calculations |
|---|---|---|
| Group | The business-friendly name of the app group. | The name comes from the shared work or capabilities of the apps in that group. |
| Primary | The app selected as the main app in the group. | The app with the highest primary score is selected, unless the evidence is too close or mixed. |
| Category | The category assigned to the primary app. | This is the primary app's catalog category. |
| Active Users | People who used the primary app during the selected time range. | Count each person who had recorded activity in the primary app during that period. |
| Candidates / Overlapping Apps | How many visible alternatives are being compared with the primary app. | Count the candidate apps that meet the dashboard's minimum evidence level. |
| Candidate Summary | A count of candidates by result: strong, weak, likely complementary. | Count each visible candidate once under its assessment label. |
| Best Overlap | The highest overlap score found among the visible candidates in the group. | Take the largest candidate overlap score. If no candidate has a score, a dash is shown. |
| Confidence | How clearly one app stands out as the primary. | Compare the leading primary score with the next score and check whether other apps lead on important usage measures. It is marked as High, Medium and low. |
| Deviations | How many unusual differences need attention. | Count the detected differences, such as unique capabilities, different user populations, or much higher candidate usage. |
Confidence labels
| Value | Explanation | Calculations |
|---|---|---|
| High | The primary app stands out clearly. | Its score is at least 70, it leads the next app by at least 25 points, and no other app clearly leads an important usage measure. |
| Medium | The primary app has a useful lead, but the result is not fully decisive. | It leads the next app by at least 15 points and no more than one important usage measure points to another app. |
| Low | A primary can be named, but the lead is limited or the signals are mixed. | The result does not meet the High or Medium rules, but it also does not meet the No clear primary rules. |
Geography and department values
| Value | Explanations | Calculations |
|---|---|---|
| Country / Department | Where the compared users are located or work. | Usage is grouped by the user's known country or department. |
| Primary users | People in that country or department who used the primary app. | Count distinct primary-app users inside that location or department. |
| Candidate users | People in that country or department who used the candidate app. | Count distinct candidate-app users inside that location or department. |
| Adoption | Candidate usage relative to primary usage in that country. | Candidate users divided by primary users, multiplied by 100. If there are no primary users, 0% is shown. |
| Exclusive Users | How much of the candidate's compared department use is not shared with the primary. | Candidate-only users divided by Shared users + Candidate-only users, multiplied by 100, then rounded. |
| Leader | Which app has more users in that country or department. | Compare candidate users with primary users. The candidate leads only when its count is higher. |
Risks and deviations
These items tell you what deserves attention before replacing or consolidating an app. They are not automatic decisions.
| Value | Explanation | Calculations |
|---|---|---|
| Risk count | How many replacement concerns are listed. | Count the candidate and group risks. If no separate risk list exists, the screen may use deviations as the review list. |
| High / Medium / Low | The importance level assigned to each review item. | Count the items in each severity. The risk bar shows each count as a share of all listed risks. |
| Top risks | The first risks to review. | Sort risks from High to Medium to Low and show the first two. |
| Deviation | A meaningful difference between the candidate and primary. | Detected from visible comparison facts such as missing or unique capabilities, a different user base, regional concentration, broader reach, higher use, specialist use, or growing use. |
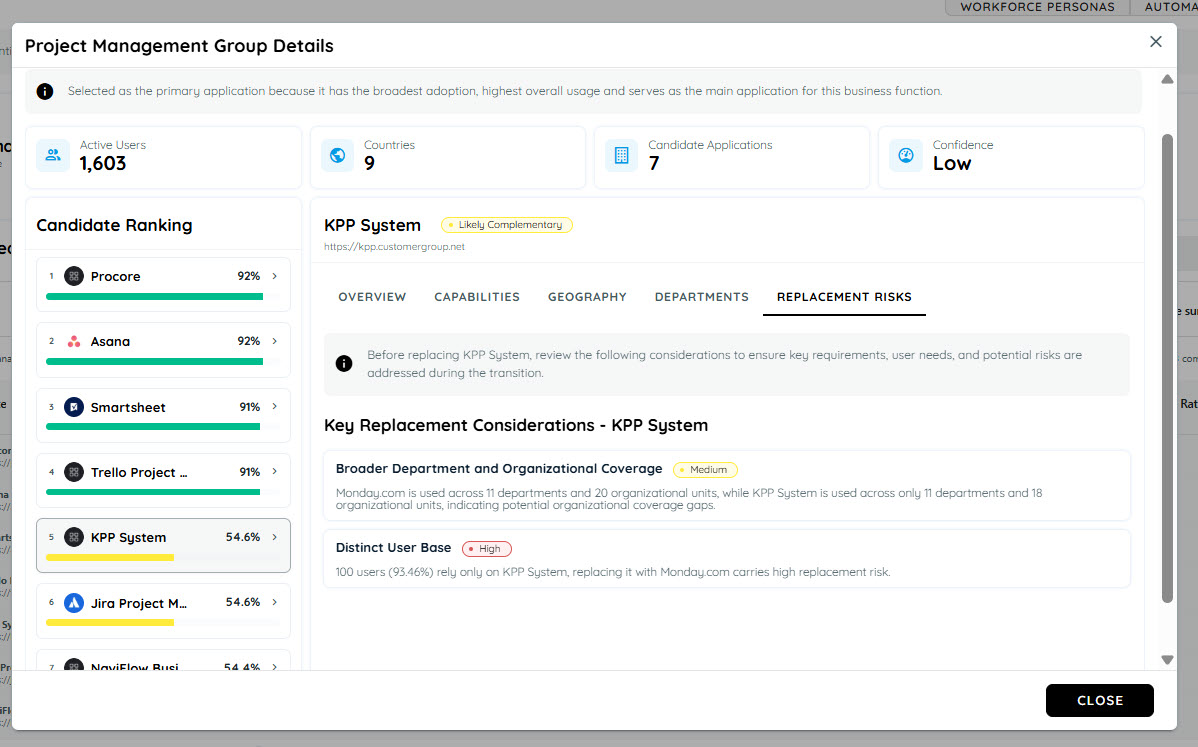
Important Note
Business requirements, user needs, costs, integrations, security, and unique application capabilities should also be considered before making a final decision.
Example
Imagine an organization uses two applications for project collaboration.
Application A
- Used by 800 users
- Provides project management and collaboration features
Application B
- Used by 600 users
- Provides similar project management and collaboration features
- 500 users use both applications
Because many users use both applications and the applications provide similar capabilities, App Redundancy may identify Application B as a potential redundancy candidate.
The organization can then investigate whether both applications are required or whether they serve different business needs.
Summary
App Redundancy gives you a simple way to identify applications that may overlap in users, functionality, or usage.
It helps you understand where potential duplication exists and provides useful information for making better application portfolio decisions.
Updated 14 days ago