Discovery Demo Data
Overview
The Discovery module allows users to import a complete set of demo data to simulate real-world analytics and insights.
This helps users explore different features such as app analytics, mission goals, user journeys, and task tracking all with realistic pre-configured data.
How to Import Demo Data
- Navigate to the Discovery page in the portal.
- Click on the three-dots menu located at the top-right corner.
- Select the Import option.
- In the dialogue window, paste the Import Discovery Data key.
- Confirm to start the import process.
- After a few moments, the system will automatically populate demo data into the Discovery sections.
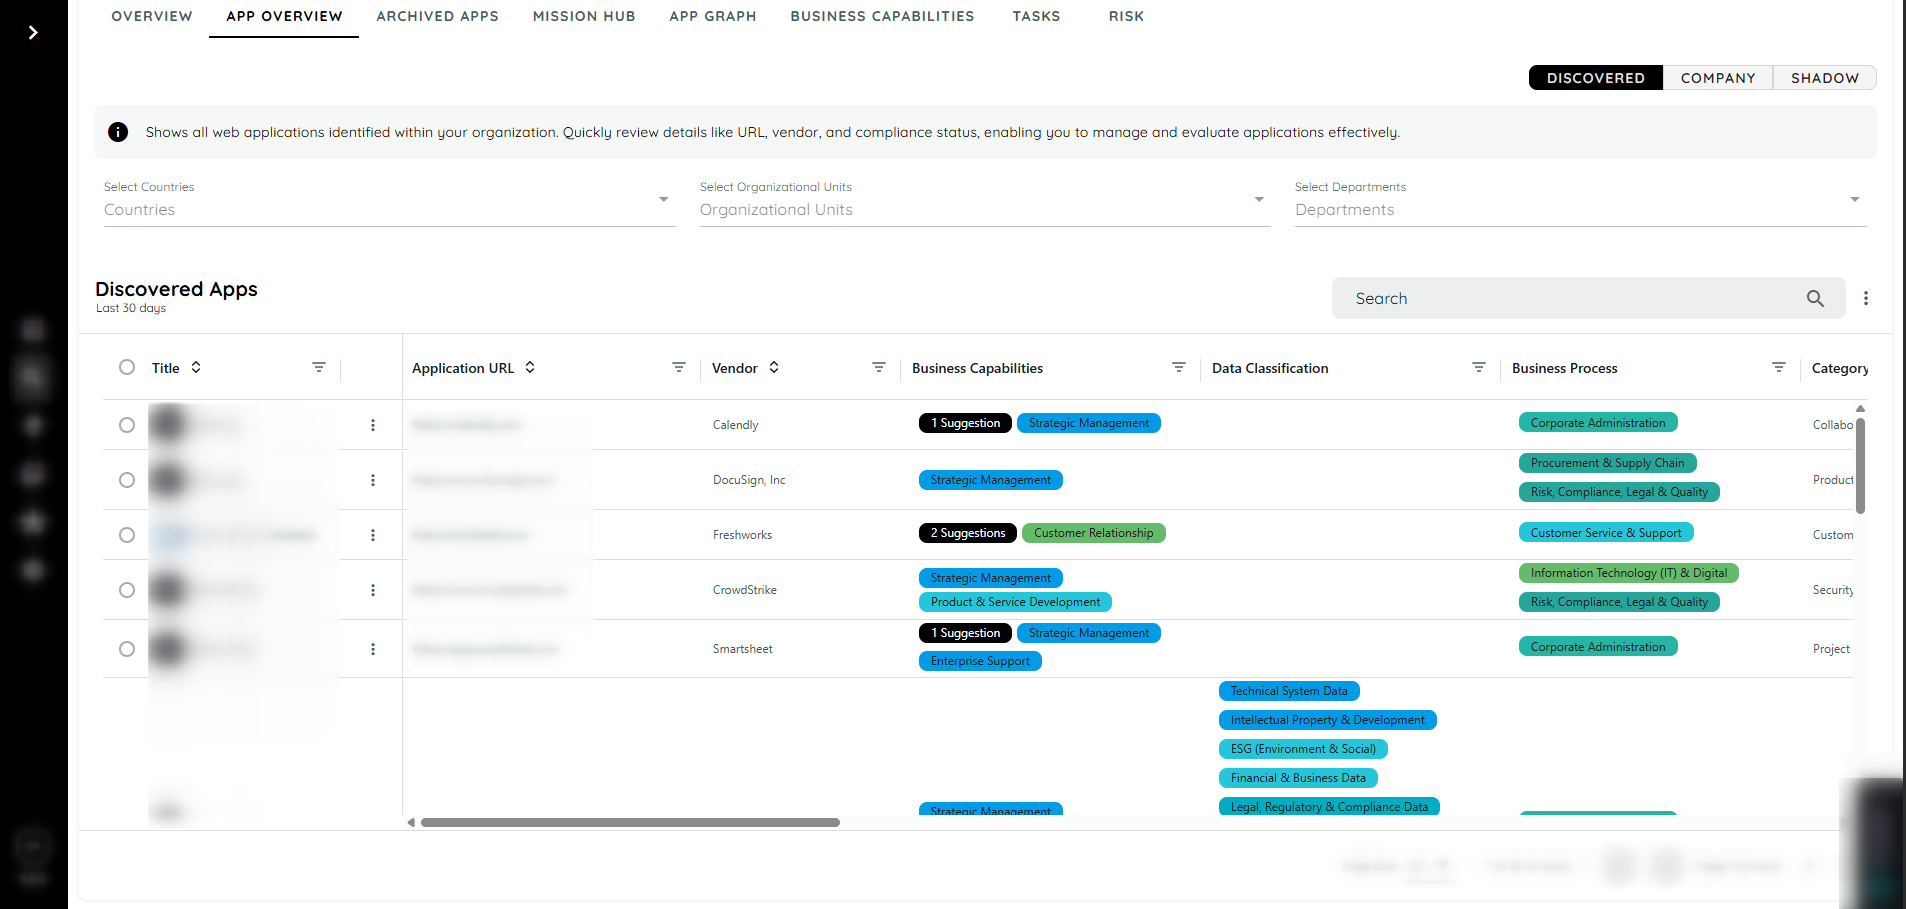
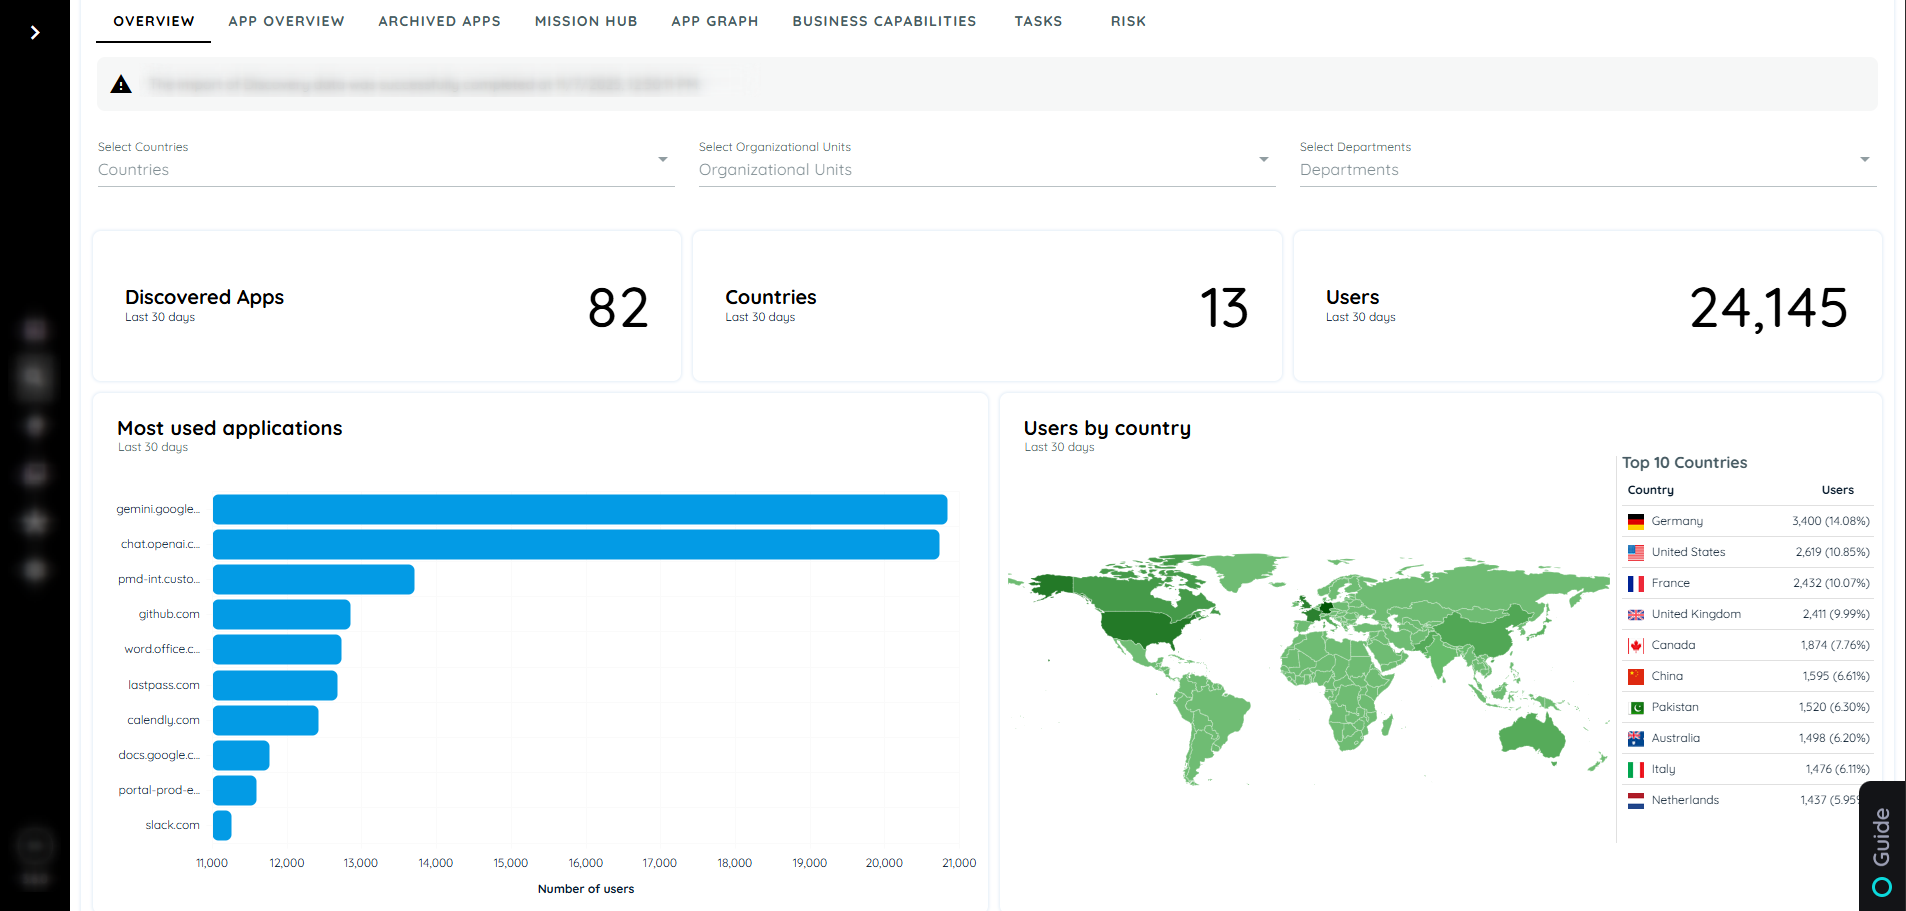
What Happens After Import
Demo data appears under Discovered Apps and Company Apps.
Each app includes metrics such as:
- Data Classification
- Business Process
- PII Inflow Risk
- PII Outflow Risk
- Business Capability
- Complete user Metrics
- Overall App Analytics with different countries, department and organizational unit
These columns represent how real applications are analyzed and categorized in Discovery.
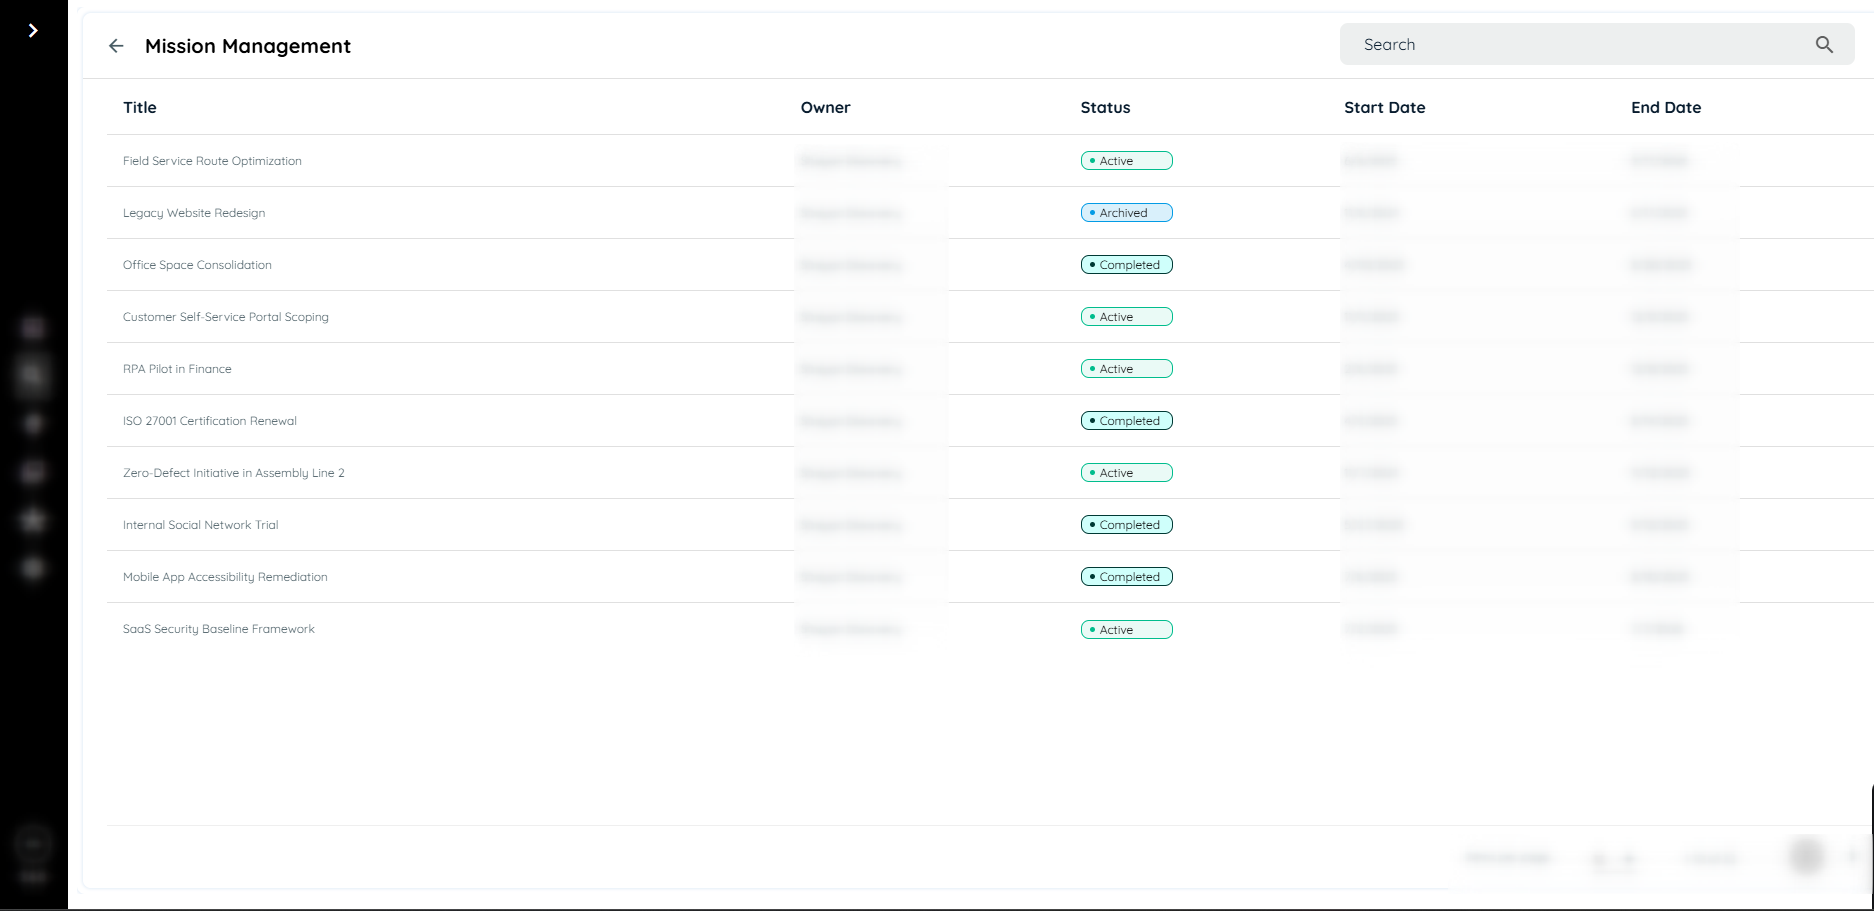
Mission Hub
Demo missions and goals are created automatically.
Each mission includes progress tracking, goal details, and performance analytics — helping users understand how organizational missions are structured and monitored.
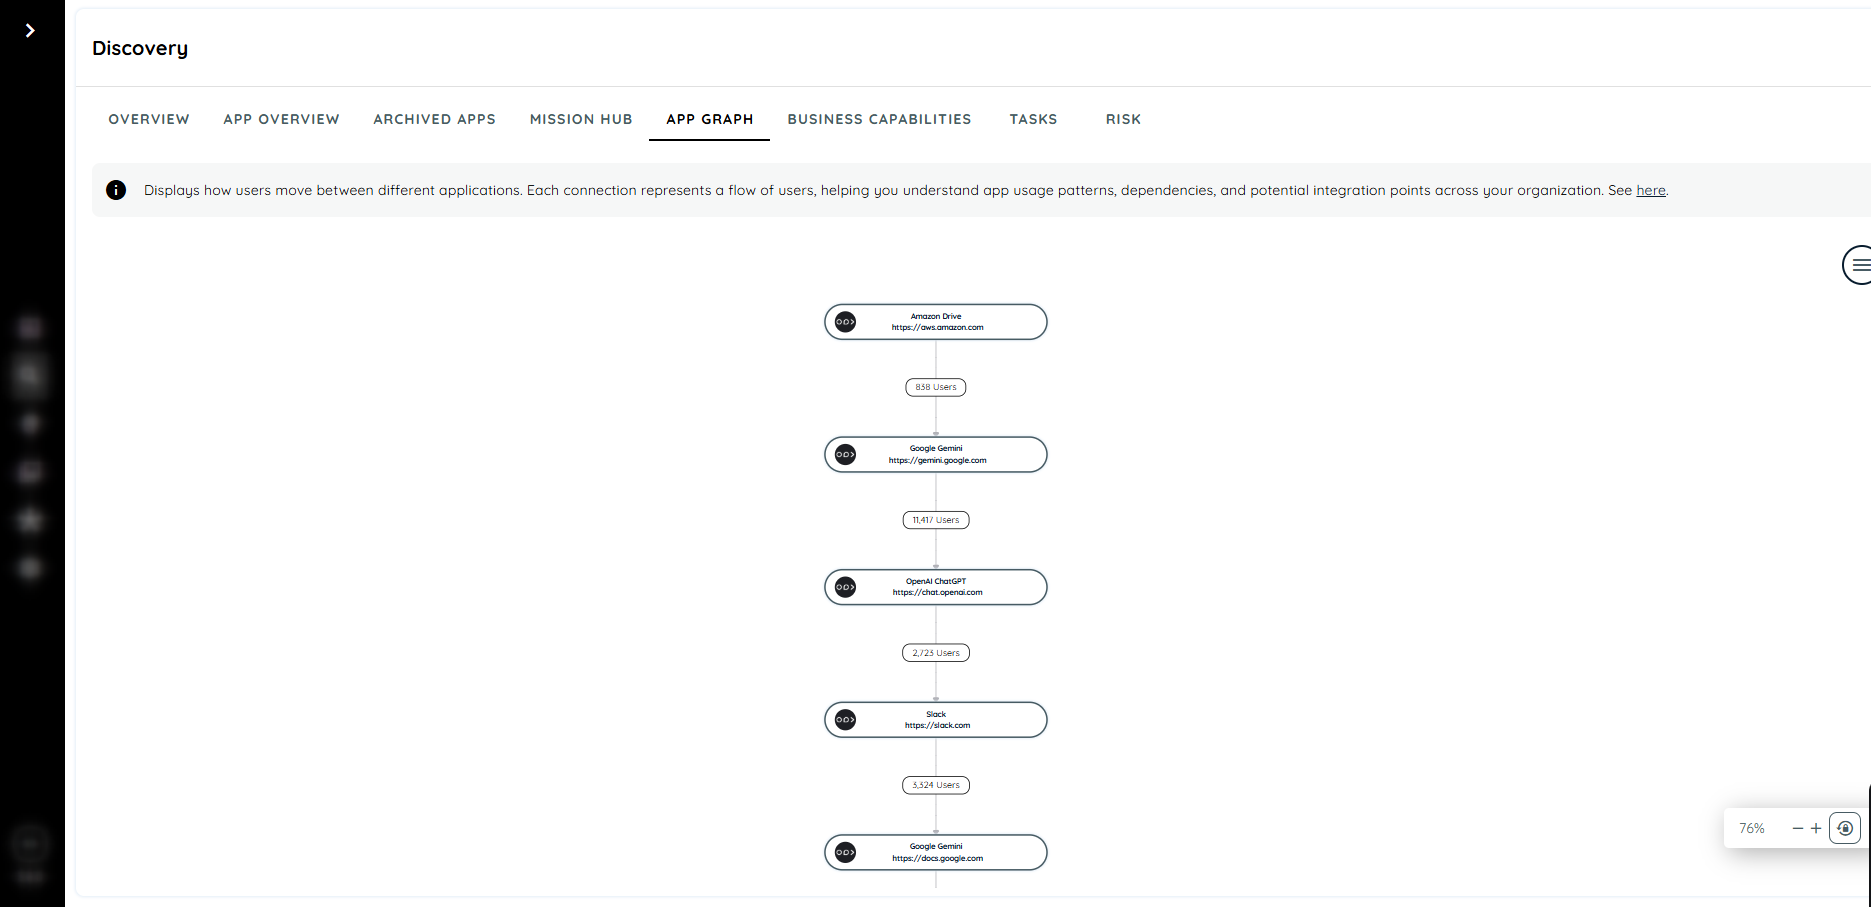
App Graph
- Pre-configured journey maps display user activity and navigation patterns across applications.
- Users can explore interactive visual graphs showing how different apps and users connect.
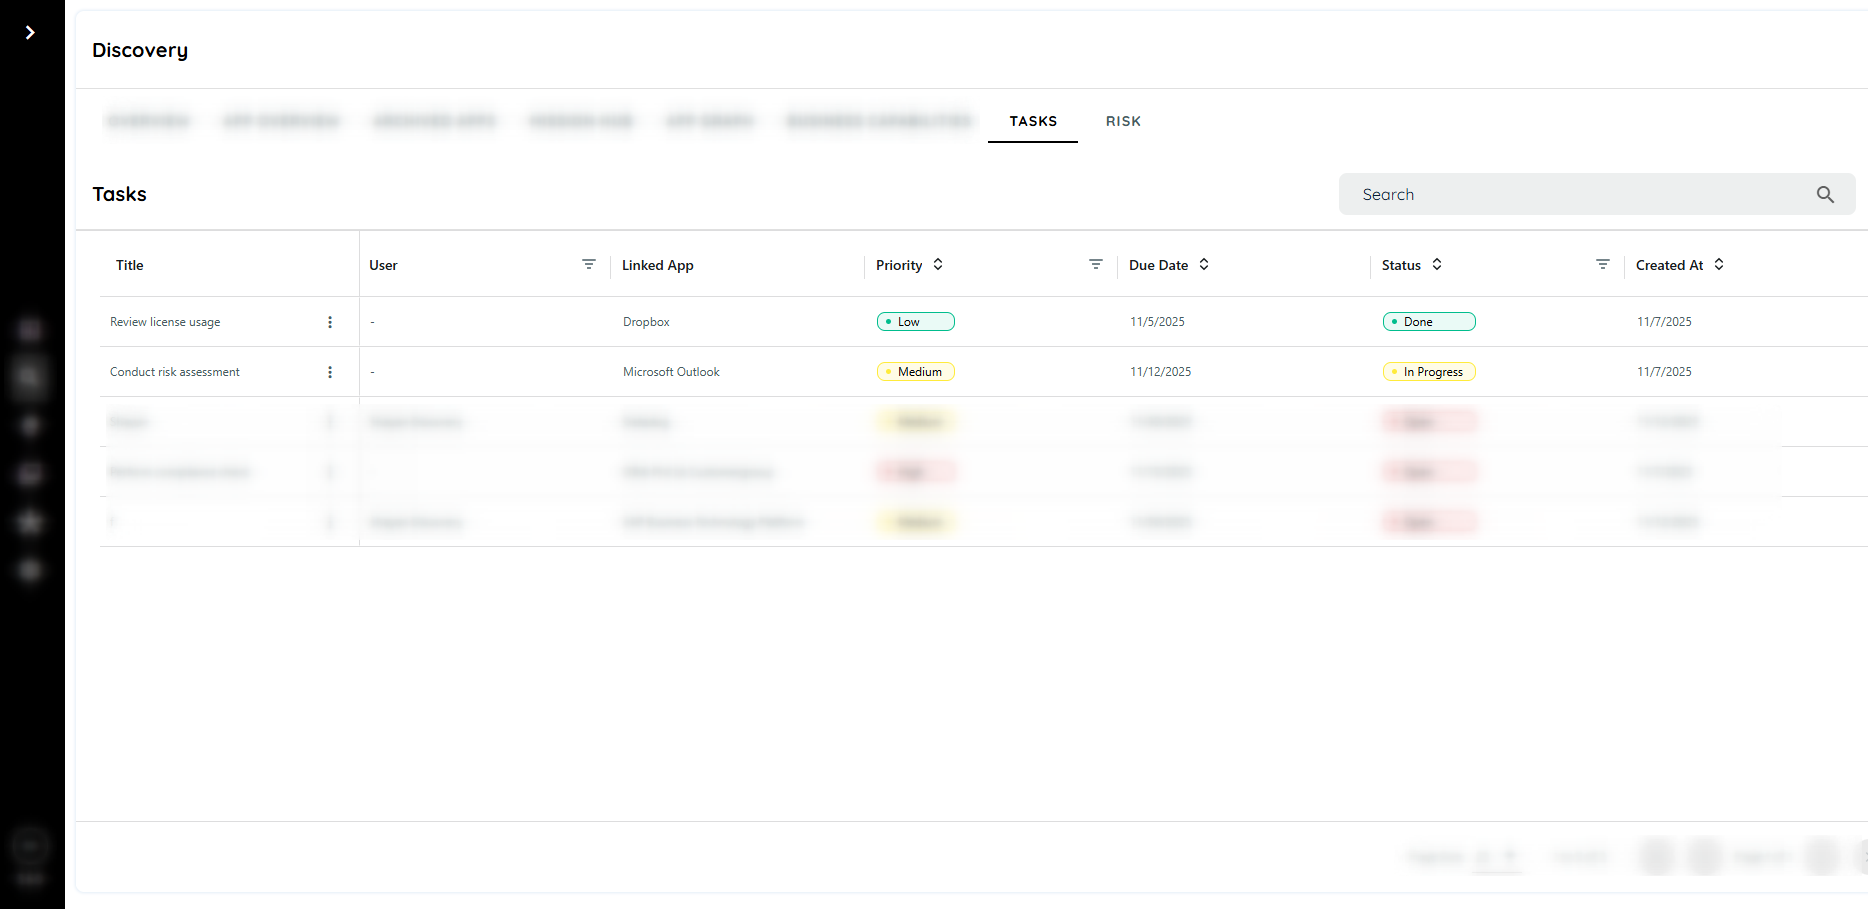
Tasks
Sample tasks are generated with demo data including:
- Title, Assigned User, Linked App, Priority, Status, Due Date, and Description.
- This helps users understand task creation, assignment, and email notification features.
- A demo email is triggered automatically to the assigned user when a task is created.
Benefits
| Benefit Type | Description |
|---|---|
| Accelerated Onboarding | Helps new users and teams quickly understand how the Discovery module functions without needing access to live production data. |
| Enhanced Decision-Making | Demonstrates how Discovery’s analytics, risk factors, and classifications can guide smarter business and compliance decisions. |
| Improved Adoption | Encourages users to explore and engage with the system more confidently when they see complete, structured demo data. |
| Consistency Across Teams | Ensures every department views the same sample structure, helping maintain uniform understanding and reducing miscommunication. |
| Faster Configuration Testing | Allows internal teams to preview how Discovery settings, journeys, and rules will behave once real data is connected. |
| Strategic Planning Support | Helps leadership visualize how applications, risks, and business processes interconnect — aiding in planning and prioritization. |
| Time and Cost Efficiency | Eliminates the need for manual data entry during setup or training, saving both time and effort across the organization. |
Expected Outcome
After successful import:
- The Discovery dashboard will be fully populated with demo data.
- Users can navigate through all sections — Applications, Mission Hub, App Graph, and Tasks — with realistic analytics.
- All graphs, statistics, and lists will function as they would with live data.
The user experiences Discovery’s complete ecosystem in an interactive, guided environment.
Summary
The Discovery Demo Data feature transforms the learning and testing experience by providing a ready-made, realistic dataset across all Discovery modules. It empowers users to understand every aspect of Discovery — from app analytics to mission tracking without needing live data. By using it, you can explore, learn, and demonstrate Discovery’s full capabilities effortlessly.
Updated 8 months ago